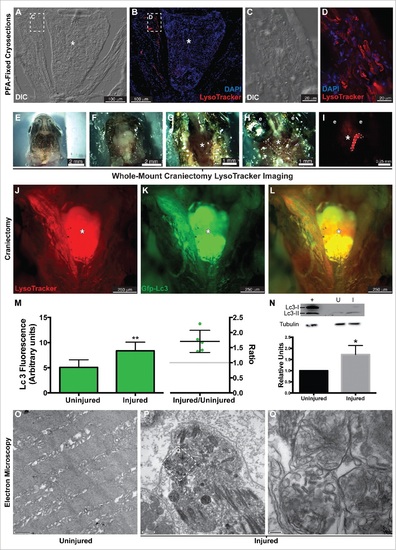
Autophagy in the regenerating EOMs. (A to L) LysoTracker Red was used to label autophagy in the regenerating LR (left side), after staining fish heads were processed for cryosectioning ((A to D). (A, B) Sections containing the regenerating LR were imaged at lower magnification. (C, D) Higher-resolution detail of the boxes in (A)and (B), respectively. ((E)to L) Craniectomy was also used to visualize LysoTracker Red labeling in situ. At 16 hpi, zebrafish heads were mounted in agarose (E), and the top of the skulls was removed (F). Brain was extracted to expose the skull base (*) where the pituitary is located and both LR muscles attach to the bone (G). Then the lateral bones of the skull were removed to allow complete visualization of the LR muscles (H). (I) Fluorescent visualization of H. LysoTracker Red (J) and GFP-Lc3 (K) clearly accumulate and colocalize (L) in the regenerating LR. (M) Fluorescence intensity of GFP signal was therefore higher in the injured muscle; in fact, the ratio of the intensities of injured vs control was higher than 1 in every fish, meaning a net increase of GFP-Lc3 content of the injured muscle (Student t test, **, P < 0.01, n = 5). (N) Western blot of Lc3 showed an increase of Lc3-II in the injured muscle, indicating again autophagy activation (Mann-Whitney test, *, P < 0.05, n = 4). Protein loading was assayed with an anti-Tubg1/tubulin antibody. +, positive control (rat protein); U, uninjured; I, injured. (O to Q) Electron microscopy showed that double-membrane organelles were easily detected in the injured muscle (P, scale bar: 500 nm; Q, scale bar: 100 nm) while virtually undetectable in the control muscle (O, scale bar: 500 nm). Check Figure 30 for a diagram of a craniectomyzed zebrafish head.
|
