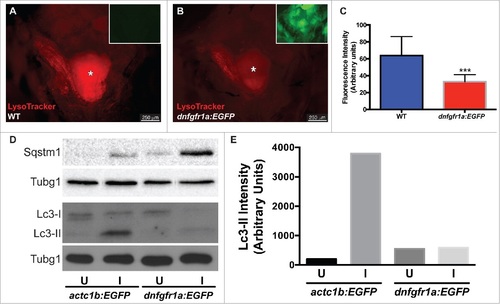
Autophagy is regulated by Fgf during EOM regeneration. (A, B) Craniectomy was again used to visualize LysoTracker Red-labeling in (A) wild-type (WT) fish, and (B) hsp70l:dnfgfr1a-EGFP; the inset shows an image of the GFP channel to confirm transgene expression and, consequently, Fgfr inhibition (pictures shown are representative examples of the 12 fish per group quantified). (C) Quantification of LysoTracker Red fluorescence intensity shows a clear decrease of LysoTracker Red labeling in hsp70l:dnfgfr1a-EGFP fish, indicating a lower autophagic flux. Values are averages ± SD (Student t test; ***, P < 0.001, n = 12). (D) Western blot of Sqstm1 and Lc3. The injured muscle of hsp70l:dnfgfr1a-EGFP fish showed higher levels of Sqstm1 and lower levels of Lc3-II (E), indicating again a lower autophagic flux. Protein loading was assayed with an anti-Tubg1/tubulin antibody. (D, E) Show a representative example of 3 independent experiments. U, uninjured; I, injured. * Skull base, where the pituitary is located.
|
