
Fig. 2
- ID
- ZDB-FIG-160526-19
- Publication
- Weaver et al., 2016 - Expression dynamics of NADPH oxidases during early zebrafish development
- Other Figures
- All Figure Page
- Back to All Figure Page
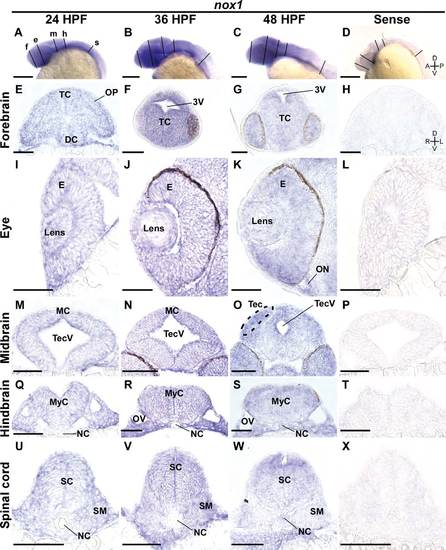
Broad nox1 expression through the first 2 days of development. A-D: Lateral views of whole-mount ISH embryos probed with antisense (A-C) and sense control (D) riboprobe against zebrafish nox1 mRNA. Lines represent the position of sections shown in E-X. E-H: 10-µm-thick transverse sections through the forebrain (line labeled “f” in A) of 24, 36, and 48 hpf embryos incubated with antisense probes (E-G, respectively) and 24 hpf embryo incubated with a sense control probe (H). I-L: Transverse sections through the eye (line labeled “e” in A). M-P: Corresponding midbrain sections (line labeled “m” in A). Q-T: Corresponding hindbrain sections (line labeled “h” in A). U-X: Corresponding spinal sections (line labeled “s” in A). Abbreviations: 3V, third ventricle; DC, diencephalon; E, eye; MC, mesencephalon; MyC, myelencephalon; NC, notochord; ON, optic nerve; OV, otic vesicle; SC, spinal cord; SM, somites; TC, telencephalon; Tec, tectum; TecV, tectal ventricle. Scale bar = 0.5 mm in A-D; 100 µm in E-X. |
| Gene: | |
|---|---|
| Fish: | |
| Anatomical Terms: | |
| Stage Range: | Prim-5 to Long-pec |