
Fig. S2
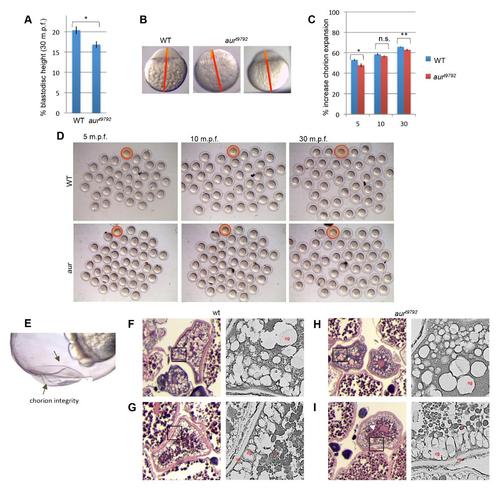
Blastodisc height and chorion expansion in wild-type and aura mutant embryos. (A,B) Blastodisc height in wild-type (n=39) and aura mutant embryos (n=42) (A). Height (orange lines, B) was measured as a percentage of the whole embryo length (red lines) at 30 mpf. Average blastodisc height in mutants is mildly yet statistically significantly reduced compared to wild-type (t-test, p-value=0.020). (C,D) Average chorion expansion in mutants is mildly yet statistically significantly reduced compared to wild-type in two of three measured time points (t-test type, p- values: 5 mpf: 0.010, 10 mpf: 0.16; 30 mpf: 0.0099). (C). Chorion lifting was measured by subtracting the area of the embryo (orange circle in D) from the area of the chorion (red circle in D). A fraction of aura mutant embryos (60%, n=1096) exhibit chorion fragility in which it separates as sublayers (E, arrows). Although we can not rule out other interpretations, this chorion fragility phenotype that can be interpreted as a consequence of reduced chorionic protein modification of chorion sublayers (Ulrich, 1969; Hart and Collins, 1991; Selman et al., 1993) due to decreased CG release in aura mutants. Embryos were a random collection from 3 females per genotype. Bars represent standard error values. Brackets reflect degree of statistical significance, with p-values < 0.01 (**), 0.01 - 0.05 (*), and > 0.05 (n.s.). Ovary sections of wild-type (pre- and post-CG (cg) accumulation at the cortex, just below the vitelline envelope (ve). F,G) and mutant (pre- and post-CG accumulation). H,I) Ovaries showing that CGs (arrowheads) are aligned at the cortex, and yolk (y) morphology is normal in aura oocytes. |
| Fish: | |
|---|---|
| Observed In: | |
| Stage: | 1-cell |