
Fig. 1
- ID
- ZDB-FIG-160225-26
- Publication
- Matsui et al., 2015 - A zebrafish jam-b2 Gal4-enhancer trap line recapitulates endogenous jam-b2 expression in extraocular muscles
- Other Figures
- All Figure Page
- Back to All Figure Page
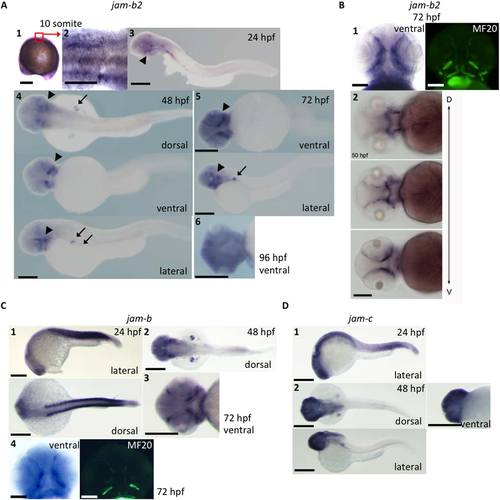
jam-b2 mRNA expression in zebrafish larvae. A1: jam-b2 is expressed ubiquitously at the 10 somite stage (scale bar = 200 µm). A2: High magnification image of A1 (scale bar = 100 µm). A3–A5: jam-b2 expression is identified in pectoral fins (arrow) and in cranial tissues (arrowhead) during 24–72 hr postfertilization (hpf; scale bar = 200 µm). A6: jam-b2 expression in EOMs and jaw muscles disappears at around 96 hpf (scale bar = 200 µm). B1: The signals detected in the cranial part represent EOMs and jaw muscles. Figures from the same embryo is presented. MF20: muscle specific antibody (scale bar = 100 µm). B2: jam-b2 expression at different focus along the dorsal–ventral axis. Figures are indicated from dorsal [D] to ventral [V] (scale bar = 200 µm). C1–C3: jam-b expression is identified in somites / myotomes, pectoral fins and cranial tissue during 24–72 hpf (scale bar = 200 µm). C4: The signals detected in the cranial part represent EOMs and jaw muscles. Figures from the same embryo is presented. MF20: muscle specific antibody (scale bar = 100 µm). D1–D2: jam-c expression is rather ubiquitous and does not show clear signals in muscles / myotomes compared with jam-b or jam-b2 (scale bar = 200 µm). |
| Genes: | |
|---|---|
| Antibody: | |
| Fish: | |
| Anatomical Terms: | |
| Stage Range: | 10-13 somites to Day 4 |