
Fig. S6
- ID
- ZDB-FIG-160212-28
- Publication
- Tomer et al., 2015 - SPED Light Sheet Microscopy: Fast Mapping of Biological System Structure and Function
- Other Figures
- All Figure Page
- Back to All Figure Page
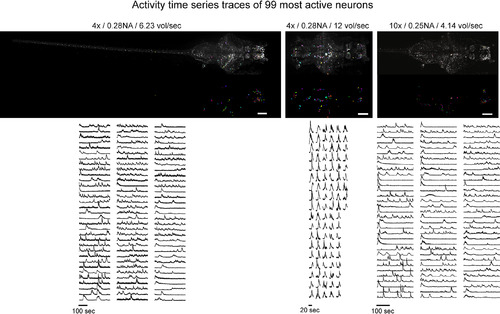
Neuronal Activity Time Series across the Intact Nervous System, Related to Figure 6 Neuronal activity traces (ΔF/F) are shown for top 99 most active neurons in the larval zebrafish nervous system (assessed by variance across the entire recording duration), imaged using 4×/0.28 NA objective at 6.23 volumes/second (3 mm × 0.5 mm × 0.2 mm, 39 z slices), 4×/0.28 NA objective at 12 volumes per second (0.9 mm × 0.4 mm × 0.2 mm, 40 z slices) and 10×/0.25 NA objective at 4.14 volumes per second (1.2 mm × 0.43 mm × 0.2 mm, 39 z slices). Spatial distribution of identified cells is overlaid on the maximum intensity projection image of voxel-wise SD across the entire recording duration. Scale bars, 100 µm. |
Reprinted from Cell, 163, Tomer, R., Lovett-Barron, M., Kauvar, I., Andalman, A., Burns, V.M., Sankaran, S., Grosenick, L., Broxton, M., Yang, S., Deisseroth, K., SPED Light Sheet Microscopy: Fast Mapping of Biological System Structure and Function, 1796-806, Copyright (2015) with permission from Elsevier. Full text @ Cell