
Fig. 4
- ID
- ZDB-FIG-160212-24
- Publication
- Tomer et al., 2015 - SPED Light Sheet Microscopy: Fast Mapping of Biological System Structure and Function
- Other Figures
- All Figure Page
- Back to All Figure Page
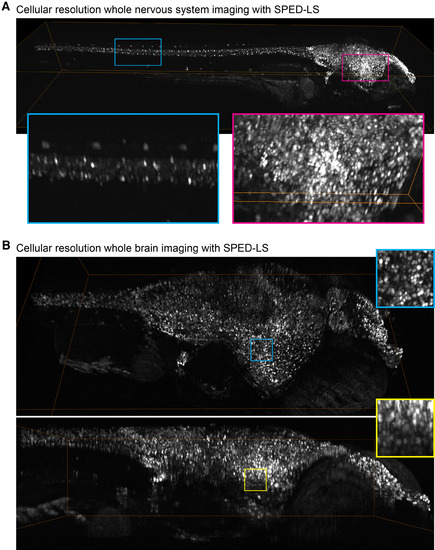
Cellular-Resolution Imaging of the Entire Larval Zebrafish CNS with SPED Light Sheet Microscopy (A and B) Volume renderings of 10 dpf Tg(elavl3:H2B-GCaMP6s) zebrafish larvae imaged with 4×/0.28NA (A) and 10×/0.25NA (B) objectives demonstrate the large field of view of SPED microscopy, while maintaining cellular resolution. Cyan and magenta boxes provide magnified views. (A) Image volumes of 10 consecutive time points were collapsed into one volume by taking the maximum values voxel-wise across the recording duration. The bounding box size is 0.75 mm × 2.99 mm × 0.48 mm. (B) Image volumes of 7 consecutive time points were collapsed into one volume by taking the maximum values voxel-wise across the recording duration. The bounding box size is 0.65 mm × 1.20 mm × 0.30 mm. See Movies S3 and S4 for detailed 3-dimensional rendering and Figure S5 for comparison of raw and deconvolved data. |
Reprinted from Cell, 163, Tomer, R., Lovett-Barron, M., Kauvar, I., Andalman, A., Burns, V.M., Sankaran, S., Grosenick, L., Broxton, M., Yang, S., Deisseroth, K., SPED Light Sheet Microscopy: Fast Mapping of Biological System Structure and Function, 1796-806, Copyright (2015) with permission from Elsevier. Full text @ Cell