
FIGURE
Fig. S5
- ID
- ZDB-FIG-160212-25
- Publication
- Tomer et al., 2015 - SPED Light Sheet Microscopy: Fast Mapping of Biological System Structure and Function
- Other Figures
- All Figure Page
- Back to All Figure Page
Fig. S5
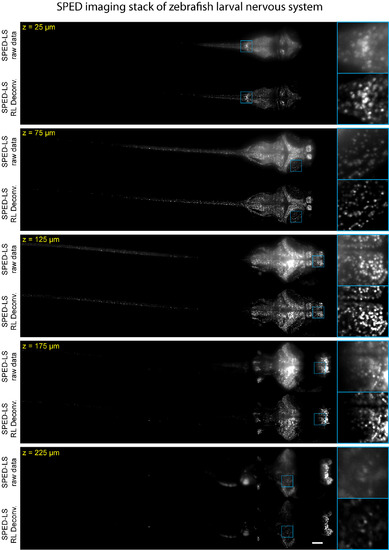
Comparison of Raw and Deconvolved SPED Light Sheet Data Stack, Related to Figure 4 A consecutive series of optical sections (50 µm thick) is shown to demonstrate image quality enhancement after deconvolution. Data were acquired from a 10 dpf Tg(elavl3:H2B-GCaMP6s) zebrafish larva using 4×/0.28NA detection objective. Image volumes of 10 consecutive time points (arbitrarily chosen number to increase labeled cell count) were combined into one volume by taking the maximum values of the voxels across the time points. Detailed volume rendering of the image stack is shown in Figure 3A and Movie S3. Scale bar, 100 µm. |
Expression Data
Expression Detail
Antibody Labeling
Phenotype Data
Phenotype Detail
Acknowledgments
This image is the copyrighted work of the attributed author or publisher, and
ZFIN has permission only to display this image to its users.
Additional permissions should be obtained from the applicable author or publisher of the image.
Reprinted from Cell, 163, Tomer, R., Lovett-Barron, M., Kauvar, I., Andalman, A., Burns, V.M., Sankaran, S., Grosenick, L., Broxton, M., Yang, S., Deisseroth, K., SPED Light Sheet Microscopy: Fast Mapping of Biological System Structure and Function, 1796-806, Copyright (2015) with permission from Elsevier. Full text @ Cell