
Fig. 4
- ID
- ZDB-FIG-160210-9
- Publication
- Dempsey et al., 2015 - Determination of the source of SHG verniers in zebrafish skeletal muscle
- Other Figures
- All Figure Page
- Back to All Figure Page
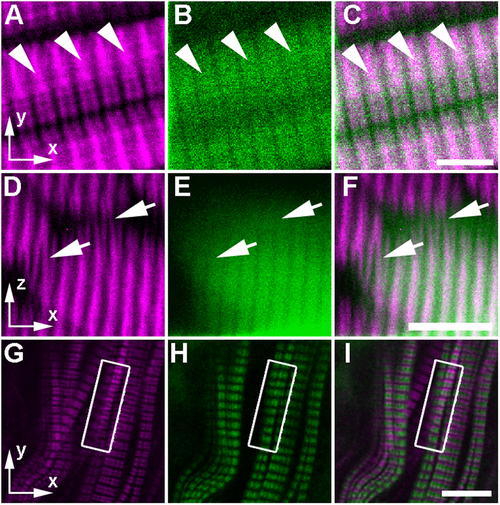
Apparent curvature in the sarcomere structure is only visible within the SHG channel when imaging fluorescently labeled sarcomeric proteins in zebrafish embryos. (A–F) In preparation for imaging, zebrafish larvae at 7 dpf were fixed and sparsely immunostained with anti-myosin MF20 primary and goat-anti-mouse-AF488 secondary antibodies (see Methods). In sagittal optical sections, (A) SHG signal (magenta) can be single banded and bifurcated, even within a single sarcomere (arrowheads), while (B) the TPEF signal (green) from each individual sarcomere can be seen as a single wide-band with gaps only at the I bands of the sarcomere (where myosin is absent), as predicted by the theoretical model. (C) The merged image shows the colocalization of SHG and TPEF signal within the thick filaments. In transverse optical sections, (D) adjacent myofibers seem to be linked by myosin verniers (arrows) in the SHG channel. (E) In the AF488 fluorescence channel (green), the banding pattern does not bifurcate at all (see the arrows pointing to the same regions as in (panel D). (F) In the merged image, the SHG signal and the fluorescent signal overlap within the labeled myofiber but do not show the same vernier signal pattern (arrows). Thus, the vernier patterns are only present in the SHG channel. (G–I) In this single sagittal optical section of the superficial slow muscle layer of a laterally mounted, fixed 5 dpf Gt(tpm3-citrine)ct5a zebrafish larva, the thin filaments are visible, because endogenous tropomyosin 3 is fluorescently tagged. The box in each panel indicates the region where distortions appear in the SHG channel alone. (G) In the SHG channel, verniers can be seen as local curvature in the sarcomeric banding pattern. (H) In contrast, there is no curvature in the TPEF banding pattern, indicating that the sarcomeres are not actually physically distorted in this region. (I) This is demonstrated further in the merge of (panels G,H), where the distorted SHG vernier signal seems to overlap with the adjacent fluorescence band within the same muscle fiber. Scale bars: (A–C), 5 µm; (D–I), 10 µm. |
| Antibody: | |
|---|---|
| Fish: | |
| Anatomical Term: | |
| Stage: | Days 7-13 |