
Fig. 5
- ID
- ZDB-FIG-160210-10
- Publication
- Dempsey et al., 2015 - Determination of the source of SHG verniers in zebrafish skeletal muscle
- Other Figures
- All Figure Page
- Back to All Figure Page
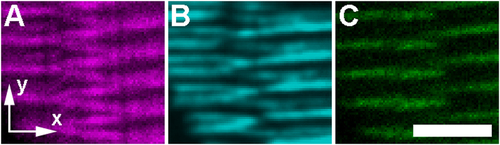
A theoretical model built upon fluorescence data agrees with actual vernier pattern SHG signal in whole mount zebrafish tissue. A fixed 5 day post fertilization zebrafish larva was immunostained with an anti-myomesin antibody, which selectively labels the M-line of skeletal muscle sarcomeres. A full 3D volume was imaged (see Supplementary Methods), and a region of interest with apparent SHG verniers was selected to test the theoretical model. (A) SHG signal (magenta) within a single optical section near the center of the imaged 3D volume shows clear vernier pattern SHG signal between two adjacent myofibers. (B) Synthetic SHG signal (cyan) was generated using our theoretical model (see Theory), starting with the (C) anti-myomesin TPEF signal (green) as a reference point for the M-line location and extent of each sarcomere. Scale bar: 5 µm. |
| Antibody: | |
|---|---|
| Fish: | |
| Anatomical Term: | |
| Stage: | Day 5 |