
FIGURE
Fig. S5
Fig. S5
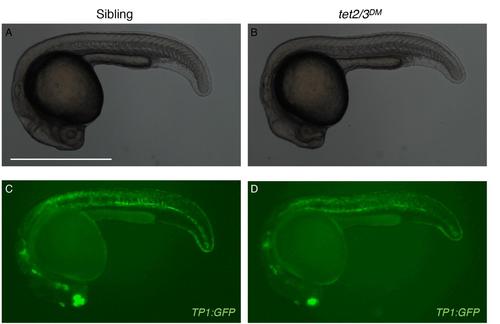
TP1:GFP expression reveals similar overall patterns of Notch signaling in sibling and tet2/3DM larvae, Related to Figure 7 (A-B) Bright-field images of a representative sibling and tet2/3DM larvae at 26 hpf. (C-D) GFP expression in TP1:GFP transgenic larvae at 26hpf. The scale bar represents 500 µm. |
Expression Data
Expression Detail
Antibody Labeling
Phenotype Data
Phenotype Detail
Acknowledgments
This image is the copyrighted work of the attributed author or publisher, and
ZFIN has permission only to display this image to its users.
Additional permissions should be obtained from the applicable author or publisher of the image.
Full text @ Cell Rep.