
Fig. 5
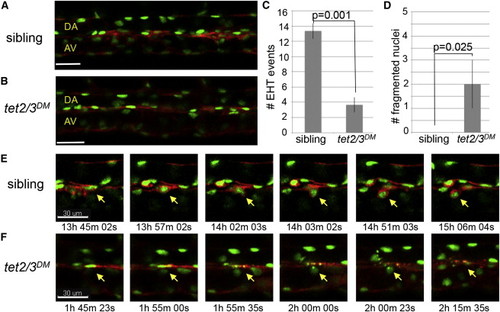
Tet2/3 Are Required for HSC Emergence through the Endothelial to Hematopoietic Transition (A and B) Merged images depicting GFP and mCherry labeling of the vasculature in Tg(kdrl:Ras-mCherry), Tg(kdrl:H2B-EGFP) transgenic larvae at 30 hpf. (C) Number of EHT events detected between 30 and 46 hpf in tet2/3DM larvae and siblings. Numerical data are presented as the mean ± SEM. (D) Number of fragmented nuclei observed in the DA of tet2/3DM larvae and their siblings between 30 and 46 hpf. Numerical data are presented as the mean ± SEM. (E) Sequences from Movie S1 documenting the stepwise emergence of an HSC from the DA of a sibling larva. For each time point, merged GFP and mCherry images are shown. The yellow arrow indicates the cell undergoing EHT. (F) Sequences from Movie S2 documenting a cell undergoing nuclear fragmentation in the DA of a tet2/3DM larva. For each time point, merged GFP and mCherry images are shown. The yellow arrow indicates the cell with nuclear fragmentation. All scale bars indicate 30 µM. See also Movies S1 and S2. |
| Genes: | |
|---|---|
| Fish: | |
| Anatomical Terms: | |
| Stage Range: | Prim-15 to High-pec |
| Fish: | |
|---|---|
| Observed In: | |
| Stage Range: | Prim-15 to High-pec |