|
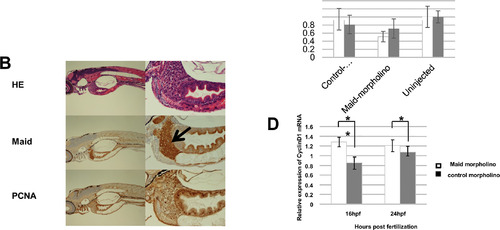
Maid expression during zebrafish development. (A) Western blot analysis of Maid expression: lane 1, ovary; 2, unfertilized egg (0 h); 3, cleavage (1.5 h); 4, blastula (4 h); 5, gastrula (10 h); 6, segmentation (20 h), and 7, hatching (72 h). Ponseau staining as a loading control. Macroscopic views of developing zebrafish embryos are also shown. (B) HE staining of whole zebrafish at the hatching stage shown at low (left) and high (right) magnifications. Black arrow indicates the liver. (C) Top: Fertilized zebrafish eggs were left uninjected (control, lane 3), or microinjected at the one- to two-cell stage with control morpholino (lane 1) or morpholino against Maid (ZHM) (lane 2). Middle: Western blot analysis was performed to detect Maid in protein isolated from these embryos at 16 hpf or 24 hpf. Results are representative of 20 embryos examined per treatment. Bottom: Graphical representation of Western blot analysis, *, p<0.05. (D) Real-time RT-PCR analysis of cyclin D1 mRNA expression in extracts of the treated zebrafish embryos in (C). Results are the mean ± SD (n = 20/group) and are expressed relative to levels of El1a mRNA (set to 1 as internal control). *, p<0.05; **, p<0.01.
|