
Fig. 2
- ID
- ZDB-FIG-150807-11
- Publication
- Dubrulle et al., 2015 - Response to Nodal morphogen gradient is determined by the kinetics of target gene induction
- Other Figures
- All Figure Page
- Back to All Figure Page
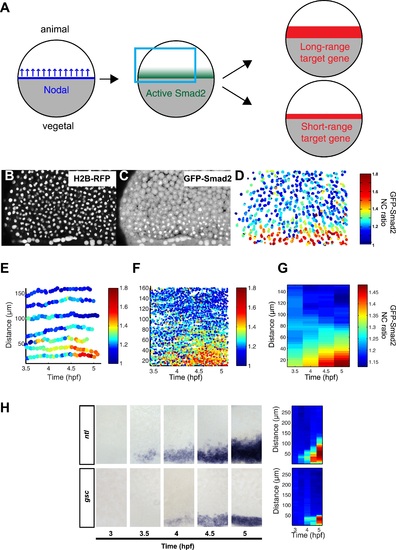
Dynamics of Nodal signaling in vivo. (A) Illustration of Nodal signaling input-output relationship during blastula stage. Gray = yolk, white = blastoderm. Nodal is produced at the margin, diffuses and forms a gradient along the vegetal-animal axis. Nodal signaling induces a gradient of activated Smad2, which induces long- and short-range target gene expression. (B and C) Maximal intensity projection of a confocal stack of a Histone 2B-RFP (B), GFP-Smad2 (C) double transgenic embryo at 50% epiboly (blue box in (A)). GFP-Smad2 strongly accumulates in the nuclei of cells close to the margin, the source of Nodal signals. (D) Heatmap of the nucleo-cytoplasmic (NC) ratio of GFP intensity from the embryo in (B and C). Each dot represents the position of a cell (overlay of five consecutive frames, 3-min intervals per frame). Each cell is color-coded according to its GFP NC ratio (see Figure 2-figure supplement 2 for movement of cells). (E) Examples of single cell tracks at different locations along the vegetal-animal axis, showing changes in GFP-Smad2 NC ratio over time. The position of most cells relative to the margin remains constant during blastula stage. Cells close to the margin activate Nodal signaling earlier and at higher levels than cells at a distance from the margin. The short bursts observed in some cell tracks are caused by transient nuclear accumulation of GFP-Smad2 at the onset of nuclear envelope breakdown and are observed even in the absence of Nodal signaling. (F) NC ratio dynamics of tracked cells along the vegetal-animal axis. (G) Mean NC ratio values from (F) in 30 min bins. Note that the range and amplitude of the Smad2 activity gradient increase over the course of 90 min. Basal NC ratio is higher in younger embryos (see Figure 2G, 3.5 hpf). Since this phenomenon is also observed in the absence of Nodal signaling (MZoep mutants), the higher NC ratio is unlikely to reflect early Smad2 activation, but a higher nuclear import/export ratio of GFP-Smad2 during early development. (H) Time course of ntl (upper panel) and gsc (bottom panel) expression detected by RNA in situ hybridization. ntl begins to be induced as early as 3.5 hpf and its domain of expression expands over time to 100-120 µm from the margin; gsc begins to be induced 30 min later than ntl and its domain of expression expands to 50 µm from the margin. Close-up views of dorsal side, animal pole to the top. Right panel, heatmap for the grayscale intensity of in situ hybridization signals along the vegetal-animal axis showing the increase in range and intensity of ntl and gsc expression over time. See Figure 2-figure supplement 3 for comparison of probes and Figure 2-figure supplement 4 for independent validation of gsc and ntl expression domains using Seurat. |
| Genes: | |
|---|---|
| Fish: | |
| Anatomical Terms: | |
| Stage Range: | High to Dome |