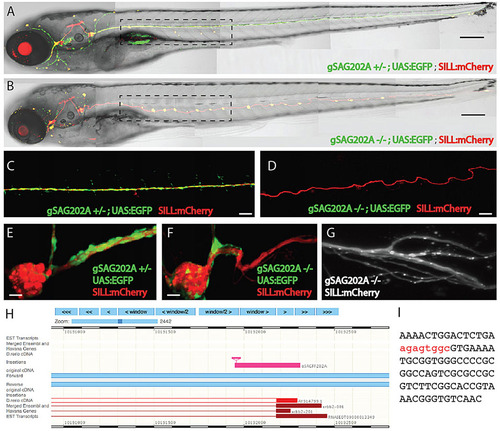
The phenotype of homozygous Tg[gSAGFF202A] fish. (A) Heterozygous Tg[gSAGFF202A;UAS:EGFP;SILL:mCherry] 5-dpf larva treated with 4-Di-2-ASP, revealing the normal pattern of neuromasts in its posterior lateral line (five neuromasts within the dashed rectangle). (B) A homozygous Tg[gSAGFF202A;UAS:EGFP;SILL:mCherry] fish at 5dpf possesses around twice as many neuromasts (ten neuromasts within the dashed rectangle). (C,E) The normal expression pattern of the posterior ganglion and lateral line in heterozygous Tg[gSAGFF202A;UAS:EGFP;SILL:mCherry] fish at 5dpf. (D,F) At 5dpf, the abnormal expression pattern of the posterior ganglion and lateral line in homozygous Tg[gSAGFF202A;UAS:EGFP;SILL:mCherry] fish, in which Schwann cells cannot migrate far away from the posterior ganglion. (G) Lattice light-sheet imaging reveals details of the axonal defasciculation in homozygous Tg[gSAGFF202A;UAS:EGFP;SILL:mCherry] larvae at 5dpf. (H) BLAST (basic local alignment search tool) shows the insertion of Gal4FF within the ErbB2 gene. (I) The integration site indicated by red nucleotides. Scale bars: 150µm (A,B), 50µm (C,D) and 10µm (E-G).
|
