
FIGURE
Fig. 6
- ID
- ZDB-FIG-150513-22
- Publication
- Korbas et al., 2008 - Localizing organomercury uptake and accumulation in zebrafish larvae at the tissue and cellular level
- Other Figures
- All Figure Page
- Back to All Figure Page
Fig. 6
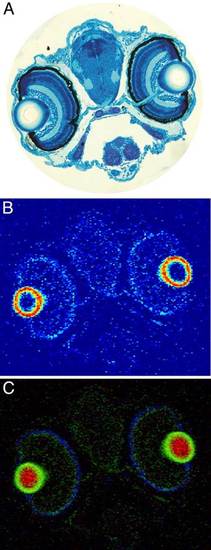
High resolution elemental distributions of zebrafish head. Head section from 4.5-dpf zebrafish larva treated with 100 µM MeHg-l-cysteine for 24 h. (A) histological image, (B) mercury distribution using x-ray fluorescence imaging at 2.5 µm resolution, and (C) Hg (green) superimposed on S (red) and Zn (blue). Quantities of the different elements are plotted on arbitrary scales. |
Expression Data
Expression Detail
Antibody Labeling
Phenotype Data
Phenotype Detail
Acknowledgments
This image is the copyrighted work of the attributed author or publisher, and
ZFIN has permission only to display this image to its users.
Additional permissions should be obtained from the applicable author or publisher of the image.
Full text @ Proc. Natl. Acad. Sci. USA