
FIGURE
Fig. 3
- ID
- ZDB-FIG-150513-19
- Publication
- Korbas et al., 2008 - Localizing organomercury uptake and accumulation in zebrafish larvae at the tissue and cellular level
- Other Figures
- All Figure Page
- Back to All Figure Page
Fig. 3
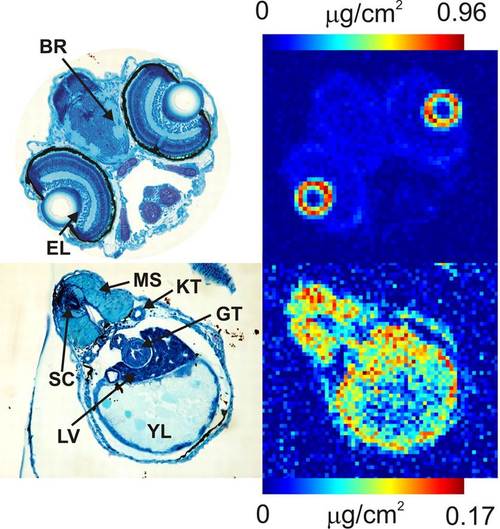
Quantitative mercury distributions of treated zebrafish. Head and liver sections from 4.5-dpf zebrafish treated with waterborne 100 µM MeHg-l-cysteine for 24 h, comparing histological images with mercury distribution of the adjacent section; (BR) brain, (EL) eye lens, (LV) liver, (GT) gut, (KT) kidney tubule, (MS) skeletal muscle, (YL) yolk, (SC) spinal cord. |
Expression Data
Expression Detail
Antibody Labeling
Phenotype Data
Phenotype Detail
Acknowledgments
This image is the copyrighted work of the attributed author or publisher, and
ZFIN has permission only to display this image to its users.
Additional permissions should be obtained from the applicable author or publisher of the image.
Full text @ Proc. Natl. Acad. Sci. USA