
FIGURE
Fig. 5
- ID
- ZDB-FIG-150513-21
- Publication
- Korbas et al., 2008 - Localizing organomercury uptake and accumulation in zebrafish larvae at the tissue and cellular level
- Other Figures
- All Figure Page
- Back to All Figure Page
Fig. 5
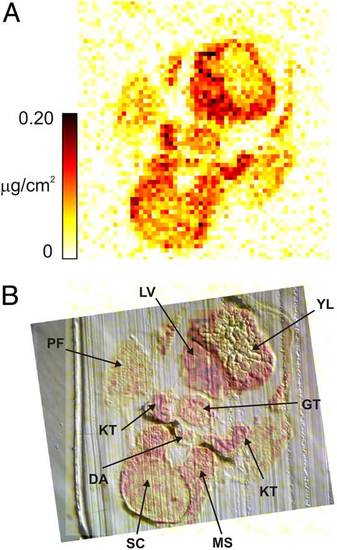
Hg distribution in the liver section from 4.5-dpf zebrafish treated with 100 µM MeHg-l-cysteine for 24 h. (A) The mercury map of the liver section and (B) the mercury map superimposed on the phase-contrast visible light micrograph of the same section to facilitate the localization of mercury within certain tissues; spinal cord (SC), skeletal muscle (MS), liver (LV), gut (GT), kidney tubule (KT), pectoral fin (PF), yolk (YL), dorsal aorta (DA). Ventral is facing the top of the page in these images. |
Expression Data
Expression Detail
Antibody Labeling
Phenotype Data
Phenotype Detail
Acknowledgments
This image is the copyrighted work of the attributed author or publisher, and
ZFIN has permission only to display this image to its users.
Additional permissions should be obtained from the applicable author or publisher of the image.
Full text @ Proc. Natl. Acad. Sci. USA