
- Title
-
Localizing organomercury uptake and accumulation in zebrafish larvae at the tissue and cellular level
- Authors
- Korbas, M., Blechinger, S.R., Krone, P.H., Pickering, I.J., and George, G.N.
- Source
- Full text @ Proc. Natl. Acad. Sci. USA

X-ray fluorescence images of intact zebrafish. Dorsal (A, B, C) and lateral (D, E, F) views of 4.5-dpf living zebrafish larva after 24-h treatment with waterborne 100 µM MeHg-l-cysteine comparing optical images (A, D) with X-ray fluorescence images at 10 µm resolution of mercury alone (B, E), and colocalization of Hg (blue) with Zn (green) and Ca (red) (C, F). |
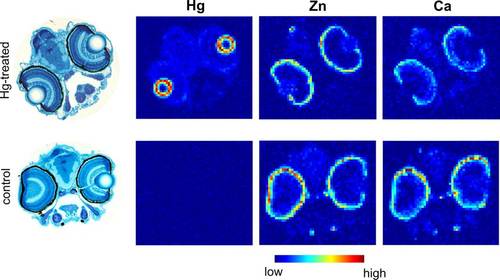
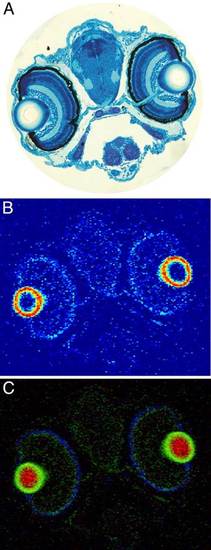
Elemental distributions in MeHg exposed and unexposed zebrafish. Comparison of elemental distributions for Hg, Ca, and Zn in sections of fish heads from 4.5-dpf larvae exposed for 24 h to 100 µM MeHg-l-cysteine (Upper) with those from control fish (Lower), measured using x-ray fluorescence imaging. Each section is paired with its respective histological image (Left). Quantities of the individual elements are plotted on the same (arbitrary) scale for Hg exposed and control sections (Hg scale from 0 to 0.96 µg/cm2). |
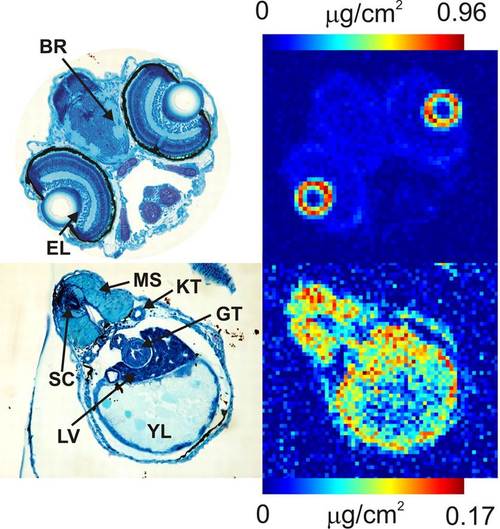
Quantitative mercury distributions of treated zebrafish. Head and liver sections from 4.5-dpf zebrafish treated with waterborne 100 µM MeHg-l-cysteine for 24 h, comparing histological images with mercury distribution of the adjacent section; (BR) brain, (EL) eye lens, (LV) liver, (GT) gut, (KT) kidney tubule, (MS) skeletal muscle, (YL) yolk, (SC) spinal cord. |
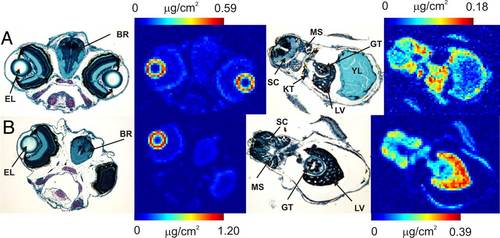
Quantitative mercury distributions of zebrafish treated with low levels of MeHg-l-cysteine. Head and liver sections from 5-dpf zebrafish larvae treated with waterborne 2 µM MeHg-l-cysteine for 36 h (A) and 7-dpf larvae treated with 200 nM MeHg-l-cysteine for 84 h (B) respectively. Histological images are compared with mercury distribution of the adjacent section; brain (BR), eye lens (EL), liver (LV), gut (GT), kidney tubule (KT), skeletal muscle (MS), spinal cord (SC). |
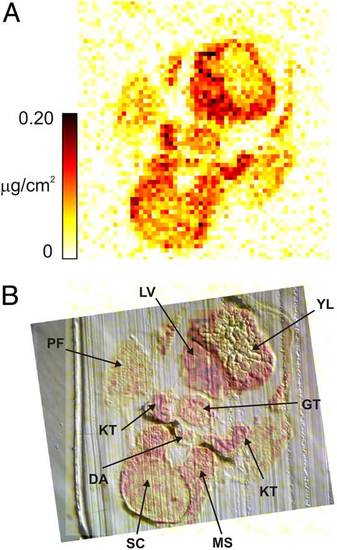
Hg distribution in the liver section from 4.5-dpf zebrafish treated with 100 µM MeHg-l-cysteine for 24 h. (A) The mercury map of the liver section and (B) the mercury map superimposed on the phase-contrast visible light micrograph of the same section to facilitate the localization of mercury within certain tissues; spinal cord (SC), skeletal muscle (MS), liver (LV), gut (GT), kidney tubule (KT), pectoral fin (PF), yolk (YL), dorsal aorta (DA). Ventral is facing the top of the page in these images. |
High resolution elemental distributions of zebrafish head. Head section from 4.5-dpf zebrafish larva treated with 100 µM MeHg-l-cysteine for 24 h. (A) histological image, (B) mercury distribution using x-ray fluorescence imaging at 2.5 µm resolution, and (C) Hg (green) superimposed on S (red) and Zn (blue). Quantities of the different elements are plotted on arbitrary scales. |