
Fig. 4
- ID
- ZDB-FIG-150430-20
- Publication
- Hui et al., 2014 - Genome wide expression profiling during spinal cord regeneration identifies comprehensive cellular responses in zebrafish
- Other Figures
- All Figure Page
- Back to All Figure Page
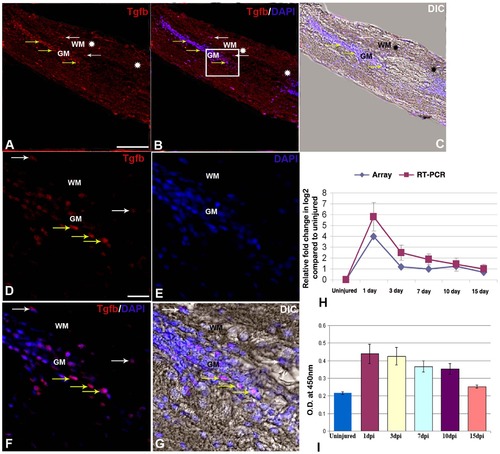
TGFβ expression in uninjured and injured zebrafish spinal cord. A) A longitudinal section of 1 dpi cord showing TGFβ positive cells in both grey matter (GM, yellow arrows) and white matter (WM, white arrows) of the cord at injury epicenter (double white star) and adjacent part. B) Same section merged with DAPI. C) Same section merged with DIC. D–G) Higher magnification of the boxed area of the section in B showing many TGFβ positive cells in both grey matter (GM, yellow arrows) and white matter (WM, white arrows) regions of the cord represented in individual panels of TGFβ (D), DAPI (E), merge of both (F) and merge with DIC (G). H) Quantitative RT-PCR of tgbβ1 expression showing fold change (red graph) and pattern of expression at different time points after injury. The temporal expression pattern of qRT-PCR (red graph) was compared with results of microarray analysis (blue graph). Error bars represent SEM, n = 3, p<0.05. I) Quantification of TGFβ expression in uninjured and injured cord at different time points by ELISA. Error bars represent SEM, n = 5, p<0.01.Scale bar = 50 µm (A–C); 10 µm (D–G). |
| Gene: | |
|---|---|
| Fish: | |
| Condition: | |
| Anatomical Term: | |
| Stage: | Adult |
| Fish: | |
|---|---|
| Condition: | |
| Observed In: | |
| Stage: | Adult |