
Fig. 7
- ID
- ZDB-FIG-150430-22
- Publication
- Hui et al., 2014 - Genome wide expression profiling during spinal cord regeneration identifies comprehensive cellular responses in zebrafish
- Other Figures
- All Figure Page
- Back to All Figure Page
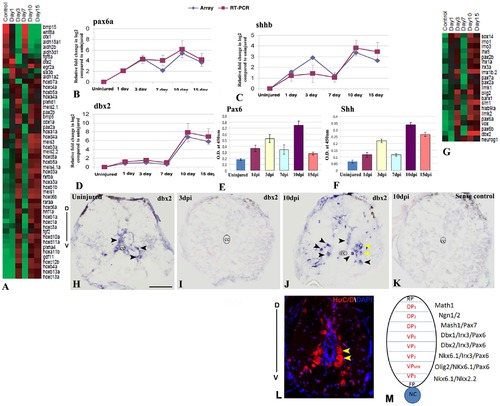
Differential expression of pattern forming genes during zebrafish spinal cord regeneration and validations of pax6a, shhb and dbx2. A) Represents known genes related to anterio-posterior patterning in CNS that are differentially expressed at different time points after SCI. The color chart indicates mean fold change of gene expression in each time points. Red and green colors represent increased and decreased expression respectively. B–D) Quantitative RT-PCR analysis of pax6a, shhb and dbx2 respectively showing fold change and differential pattern of expression in various time points after injury and compared with the temporal expression patterns of microarray data. Error bars represent SEM, n = 3, p<0.01. E–F) Quantitative analysis of PAX6 and SHH expression by ELISA in uninjured and injured cord at different time points. Error bars represent SEM, n = 5, p<0.001. G) Represents known genes related to dorso-ventral patterning in CNS that are differentially expressed at different time points after SCI. The color chart indicates mean fold change of gene expression in each time points. Red and green colors represent increased and decreased expression respectively. H–K) In situ hybridization of dbx2 in uninjured (H), 3 dpi (I) and 10 dpi (J) cord section shows presence of dbx2 transcripts in few neurons (black arrowheads) in uninjured cord but complete absence of dbx2 transcripts in 3 dpi cord and reappearance of dbx2 transcripts in many neurons in 10 dpi cord (black arrowheads). Significantly, higher numbers of dbx2 positive cells are present in the ventral side of the 10 dpi cord compared to uninjured cord. Yellow arrows indicate neurons of ventral progenitor domain. Section in K represents sense control of dbx2 in a 10 dpi cord. The mark ‘cc’ denotes central canal of the cord. ‘D’ and ‘V’ indicates dorsal and ventral side of the cord respectively. L) Representative transverse section of 10 dpi cord stained with HuC/D and DAPI showing the distribution of regenerated neurons in the dorso-ventral axis of the cord. Yellow arrows indicate neurons of ventral progenitor domain. M) A schematic diagram of various progenitor domains in dorso-ventral axis of spinal cord on the basis of spatial distribution and gene expression, adapted from Wilson and Maden [81]. ‘D’ and ‘V’ indicates dorsal and ventral side of the cord respectively. RP = Roof plate, FP = Floor plate, NC = Notochord, DP = Dorsal progenitor, VP = Ventral progenitor. Scale bar = 50 µm. |
| Genes: | |
|---|---|
| Fish: | |
| Condition: | |
| Anatomical Terms: | |
| Stage: | Adult |
| Fish: | |
|---|---|
| Condition: | |
| Observed In: | |
| Stage: | Adult |