
FIGURE
Fig. S5
- ID
- ZDB-FIG-210128-176
- Publication
- Hui et al., 2014 - Genome wide expression profiling during spinal cord regeneration identifies comprehensive cellular responses in zebrafish
- Other Figures
- All Figure Page
- Back to All Figure Page
Fig. S5
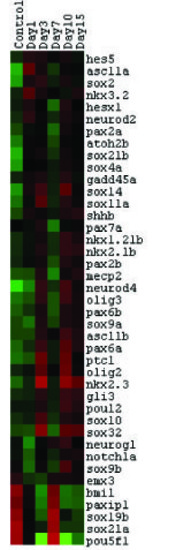
Dendrogram represents differential expression pattern of transcription factors involved in neurogenesis and neuronal specification during regeneration of zebrafish spinal cord. Each horizontal line indicates the expression pattern of each gene and the vertical columns indicate the uninjured control and time points after SCI. The color chart indicates mean fold change of gene expression in each time points. Red and green color represents increased and decreased expression respectively. |
Expression Data
Expression Detail
Antibody Labeling
Phenotype Data
Phenotype Detail
Acknowledgments
This image is the copyrighted work of the attributed author or publisher, and
ZFIN has permission only to display this image to its users.
Additional permissions should be obtained from the applicable author or publisher of the image.
Full text @ PLoS One