
Fig. 2
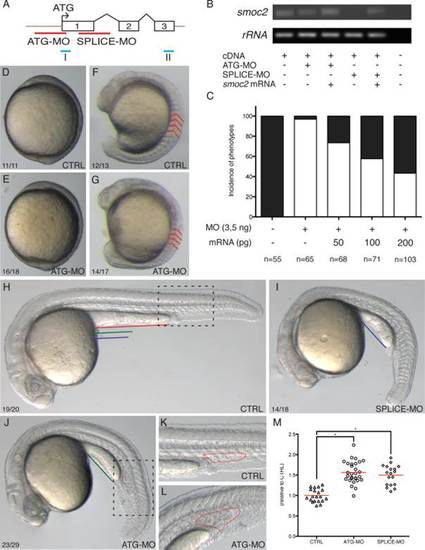
Morphological defects in smoc2 morphant zebrafish embryos. A: Diagram illustrating the design of the ATG-MO and the SPLICE-MO. B: RT-PCR at 24 hpf using primers I and II indicated in A. C: Dose response analysis after co-injecting smoc2 ATG-MO and smoc2 mRNA. D–L: Lateral view of control embryos (D,F,H,K) and smoc2 morphants (E,G,I,J,L) at bud stage (D,E; anterior to the top), 15 ss (F,G; anterior to the top) and at the onset of blood cell circulation (H–L; anterior to the left). smoc2 morphants showed a reduced axial length (F–J), loss of “v-shaped” somites (compare red lines in F and G), shortened yolk sac extension (compare colored lines in H–J), a downward curvature of the tail (H–J) and denser and enlarged blood islands (H–J and magnification of the dotted region in K and L). M: Quantification of the size of the PBI of control embryos (n = 20), ATG morphants (n = 29; *P < 0.05), and SPLICE morphants (n = 18; *P < 0.05). |
| Fish: | |
|---|---|
| Knockdown Reagents: | |
| Observed In: | |
| Stage Range: | 14-19 somites to Prim-5 |