
Fig. 2
- ID
- ZDB-FIG-150311-8
- Publication
- Le Pabic et al., 2014 - Fat-Dachsous Signaling Coordinates Cartilage Differentiation and Polarity during Craniofacial Development
- Other Figures
- All Figure Page
- Back to All Figure Page
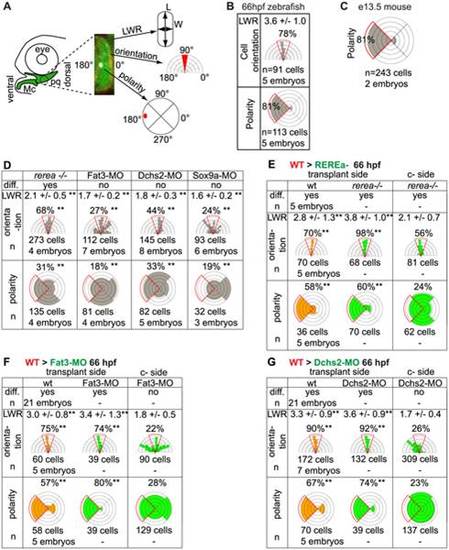
Quantification of differentiation, cell shape, cell orientation and cell polarity. (A) Cell length-width ratio (LWR) and orientation of longest cell axis were measured in pq to quantify cell stacking. Intracellular localization of microtubule organizing centers (MTOC) was recorded as readout of cell polarity. (B) LWR, cell orientation and polarity in WT zebrafish pq. (C) Polarity quantification in mouse proximal Mc. (D) LWR, cell orientation and polarity significantly differed (**) from WT values in all mutant and MO-treated embryos (p<0.001; Watson′s U2 test). (E–G) LWR, cell orientation and polarity significantly differed (**) between transplant side and control side (p<0.001; Watson′s U2 test). diff.: differentiation; c-side: control side. Mc: Meckel′s; pq: palatoquadrate. |