
FIGURE
Fig. S2
- ID
- ZDB-FIG-150311-26
- Publication
- Le Pabic et al., 2014 - Fat-Dachsous Signaling Coordinates Cartilage Differentiation and Polarity during Craniofacial Development
- Other Figures
- All Figure Page
- Back to All Figure Page
Fig. S2
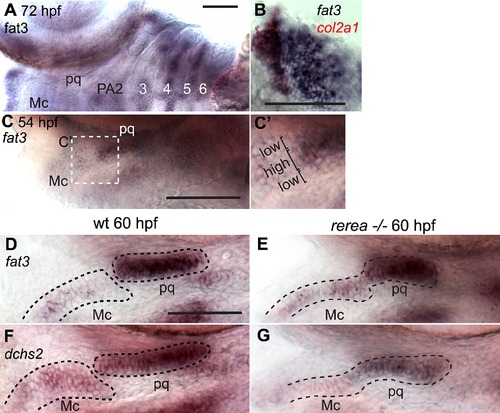
fat3 and dchs2 expression in WT and rerea-/- embryos. In situ hybridizations, lateral views, anterior to the left. (A) fat3 is expressed in presumptive cartilages of the posterior pharyngeal arches at 72 hpf, and expressed in the pectoral fin blade at 66 hpf (B). (C, C′) Lower levels of fat3 expression are also detected in cells surrounding the chondrogenic area. (D–G) fat3 (E) and dchs2 (G) are expressed in presumptive cartilages of rerea-/- embryos. Scale bar = 54 µm. Mc: Meckel′s; pq: palatoquadrate. |
Expression Data
| Genes: | |
|---|---|
| Fish: | |
| Anatomical Terms: | |
| Stage Range: | Pec-fin to Protruding-mouth |
Expression Detail
Antibody Labeling
Phenotype Data
Phenotype Detail
Acknowledgments
This image is the copyrighted work of the attributed author or publisher, and
ZFIN has permission only to display this image to its users.
Additional permissions should be obtained from the applicable author or publisher of the image.
Full text @ PLoS Genet.