
Fig. 6
- ID
- ZDB-FIG-140909-37
- Publication
- Rong et al., 2014 - R-Spondin 3 Regulates Dorsoventral and Anteroposterior Patterning by Antagonizing Wnt/β-Catenin Signaling in Zebrafish Embryos
- Other Figures
- All Figure Page
- Back to All Figure Page
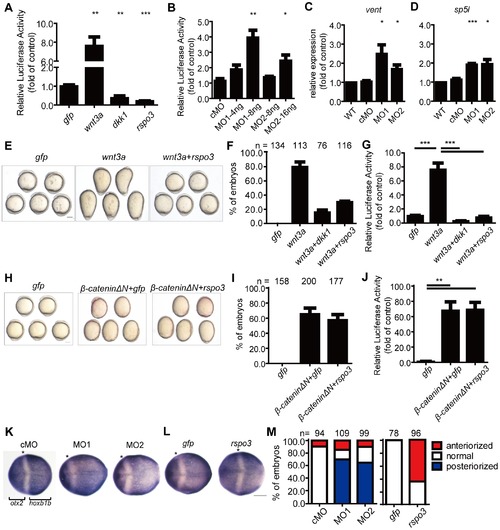
Rspo3 inhibits the zygotic Wnt/β-catenin signaling in zebrafish embryos. (A) Rspo3 inhibited Wnt/β-catenin reporter activities. One-cell stage embryos were injected with Topflash reporter DNA together with 600 pg gfp mRNA, 20 pg wnt3a mRNA, 200 pg dkk1 mRNA, or 600 pg rspo3 mRNA, respectively. Injected embryos were raised to the shield stage and the luciferase activity was measured. Values are means ± S.E. (n = 3). **, ***P<0.01 and 0.001 vs. the gfp group. (B) Knockdown of rspo3 increased Wnt/β-catenin reporter activity. One-cell stage embryos were injected Topflash reporter DNA together with cMO (16 ng), MO1, or MO2, respectively. Injected embryos were raised to the shield stage and the luciferase activity was measured. (C and D) Knockdown of rspo3 increased the expression levels of vent (C) and sp5l (D) mRNA. Embryos were injected with cMO (8 ng), MO1 (4 ng) or MO2 (8 ng) at the one-cell stage, and wild-type embryos were used as control. The vent and sp5l mRNA levels were measured by RT-qPCR at the 90% epiboly stage. Values are means ± S.E. (n = 3). *, **, ***P<0.05, 0.01, and 0.001 vs. the cMO group. (E) Rspo3 inhibited Wnt3a activity. Representative views of embryos. The pictures were taken at the 5-somite stage. (F) Quantitative results. The percentages of dorsalized embryos described in (E) were calculated and shown. The total embryo numbers are given at the top. Embryos were injected with 600 pg gfp mRNA, 20 pg wnt3a mRNA, 20 pg wnt3a mRNA plus 200 pg dkk1, or 600 pg rspo3 mRNA. (G) Rspo3 inhibited Wnt3a-stimulated Topflash reporter activity. One-cell stage embryos were injected with Topflash DNA together with the indicated mRNA, the injected embryos were raised to the shield stage and luciferase activities were determined. Values are means ± S.E. (n = 3). ***P<0.0001, one-way ANOVA test. (H) Rspo3 cannot inhibit β-cateninΔN activity. Representative views of embryos injected with 600 pg gfp mRNA, 50 pg β-cateninΔN mRNA, or 50 pg β-cateninΔN plus 600 pg rspo3 mRNA. The pictures were taken at the 5-somite stage. (I, J) Quantitative results (I) and luciferase activity assay (J). Values are means ± S.E. (n = 3). **P<0.01, one-way ANOVA test. (K) Knockdown of rspo3 decreased the expression of otx2 and increased the expression of hoxb1b at the 100% epiboly stage. (L) Overexpression of rspo3 increased the expression of otx2 and decreased the expression of hoxb1b at the 100% epiboly stage. Dorsal views with anterior to the left are shown. Asterisks indicate the edges of the expression domains (K, L). Scale bars = 200 μm. (M) The percentage of embryos were calculated and shown. The results are from three independent experiments, and the total embryo numbers are given at the top. |
| Genes: | |
|---|---|
| Fish: | |
| Knockdown Reagents: | |
| Anatomical Terms: | |
| Stage: | Bud |