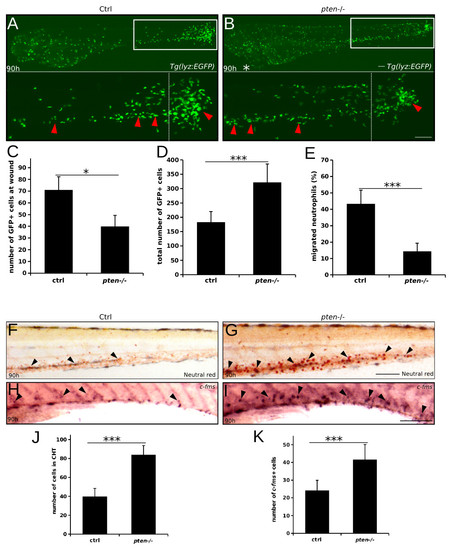
The immune response of expansive myeloid cells is impaired in pten-/- embryos. (A and B) Tail transection analyses of myeloid cell movement in response to inflammation. The myeloid cells of the control and pten-/- embryos moved to the wound site at 6 hours post-transection (hpt) (90 hpf) (A and B, white boxes). The red arrowheads indicate the myeloid cells away from the wound (A and B, left region of the lower panels) and the myeloid cells that arrived at the wound (A and B, right region of the lower panels). A white asterisk indicates the heart edema of pten-/- embryos. (C-E) Quantification of myeloid cells in the region to the right of the white dashed line (A and B, lower panel) (C) and the total number of myeloid cells (D) in each embryo. (E) The percentage of myeloid cells that migrated to the wound. (F and G) Neutral Red staining of macrophages at 90 hpf. The black arrowheads indicate macrophages in the CHT. (H and I) Whole-mount in situ hybridization analyses of macrophages with riboprobe for c-fms. The black arrowheads indicate macrophages in the CHT. (J and K) Statistical results of F, G and H, I respectively. The data shown are the means ± SEM of at least 30 embryos; ***p < 0.001 versus the control. Scale bar: 100 μm.
|
