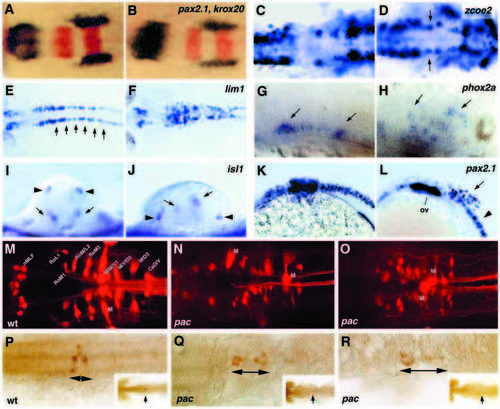
Lack of Ncad causes neuronal positioning defects. In situ hybridization (A-L), retrograde labeling of reticulospinal neurons (M-O) and tracing of cellular clones after labeling single neuroectodermal cells at the gastrula stage (P-R). All paired panels in A-L compare a pac mutant (right) with a wild-type sibling (left). (A-F) Dorsal views of the mid- and hindbrain, anterior towards the left; (G,H,K,L) sagittal views of the mid- and hindbrain, anterior towards the left; (I,J) optical cross-sections at hindbrain level, dorsal upwards. (A,B) pax2.1 (blue) and krox20 (red), 18-somite stage. (C,D) zcoe2, 18-somite stage, arrows in D indicate misplaced motoneurons in the midbrain-hindbrain boundary region. (E,F) lim1; 26 hpf; arrows in E indicate the rhombomeric pattern, altered in pac (F). In addition, note that the number of lim1-positive cells in the mutant is strongly increased. (G,H) phox2a, 36 hpf; arrows indicate ventral and dorsally misplaced motoneurons. (I,J) isl1, 24 hpf; arrows indicate motoneurons, arrowheads indicate Rohon-Beard sensory neurons. (K,L) pax2.1, 26 hpf; arrow in L indicates scattered interneurons in hindbrain area. ov, otic vesicle. (M-N) Pattern of reticulospinal neurons (specified in M) in wild-type (M) and two different pacpaR2.10 mutant embryos (N,O; Mauthner neurons are indicated by ‘M’); dorsal view on midbrain-hindbrain region at 120 hpf. Patterns in mutants appear randomized, and differ from individual to individual. Although each labeling is unlikely to label all reticulospinal neurons, the patterns observed clearly lack bilateral symmetry at least for the Mauthner neuron (identified by its characteristic elongated shape and large diameter axon, out of focus on O). (P-R) Representative clones (brown) deriving from labeled single cell of the hindbrain region of a wild-type (P) and two pacpaR2.10 mutant gastrulae (Q,R). Dorsal view of the hindbrain at 24 hpf. Arrows indicate the length of the clones along AP axis. Insets show overviews of the activated embryos, indicating the position of the clones in each embryo (arrows).
|
