
Fig. 6
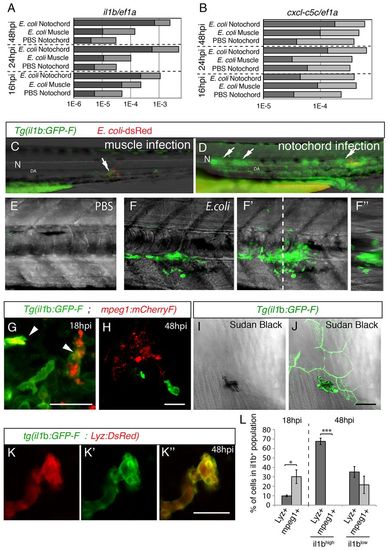
GFP expression in Tg(il1b:GFP-F) infected larvae. (A,B) The relative expression of il1b (A) and of cxcl-c5c (B) at different timepoints post-infection, under three different conditions – PBS injected into the notochord, E. coli injected into muscle and E. coli injected into the notochord. Quantitative real-time RT-PCR on whole embryo RNA extracts using ef1a as a reference gene was performed; light grey bars represent the 95% confidence intervals (Student’s t-test). Non-overlapping light grey bars indicate P<0.05. These results are representative of three independent experiments. (C,D) GFP expression at 24 hpi in Tg(il1b:GFP-F) larvae that had been injected with E. coli (red) into muscle (C) or the notochord (D). Arrows indicate expression next to inflammation sites. N, notochord; DA, dorsal aorta. (E,F) Multiscan confocal analysis of GFP expression in Tg(il1b:GFP-F) larvae in the notochord region 48 hours following the injection of PBS or E. coli. (E-F2) Maximum projections, (F) longitudinal- and (F3) cross-section views. The dashed line indicates the position of cross-section F3 relative to F. (G,H) The expression of mCherry (red) and GFP (green) in Tg(mpeg1:mCherryF ; il1b:GFP-F) double transgenic larvae at 18 (G) and 48 hpi (H) in the notochord region was analysed by using confocal microscopy. Arrowheads indicate macrophages expressing GFP. (I,J) Sudan-black staining and GFP expression in Tg(il1b:GFP-F) larvae was analysed by using confocal microscopy at 48 hpi. The images show a GFP+ neutrophil underneath GFP+ keratinocytes. (K-K3) The expression of DsRed (red) and GFP (green) in Tg(Lyz:DsRed ; il1b:GFP-F) double transgenic larvae at 48 hpi was analysed by using confocal microscopy. A merged image is shown on the right. (L) Quantification of il1b+; mpeg1+ and il1b+; Lyz+ cells in the inflammation region. Counts are expressed as the percentage of cells within the population expressing GFP (il1b+, il1blow or il1bhigh). *P<0.05, **P<0.005 and ***P<0.001. Scale bars: 20 μm. |
| Genes: | |
|---|---|
| Fish: | |
| Condition: | |
| Anatomical Terms: | |
| Stage Range: | 14-19 somites to Long-pec |