
Fig. 5
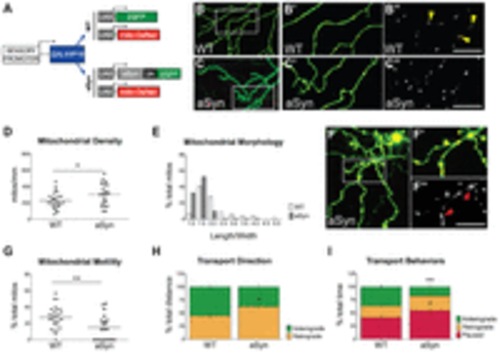
Early mitochondrial pathology and transport impairments in aSyn-expressing axons. (A) Transgenes used to visualize mitochondria in GFP-(WT) or aSyn-2A-GFP-expressing peripheral sensory neurons. Transgenes were co-injected into wild-type embryos at the one-cell stage. WT (B-B3) and aSyn-expressing (C-C3) cells were imaged at 2 dpf. Yellow arrowheads point to elongated mitochondria in wild-type axons. (D) Mitochondrial density was higher in aSyn-expressing cells (WT: 226.2±19.1 mitochondria/μm, n=26 axons in 12 animals; aSyn: 302.0±29.8 mitochondria/μm; n=20 axons in 10 animals, *P =0.031). (E) Mitochondrial morphology was quantified as the ratio of length to width in individual mitochondria. Values were binned and the frequency distribution was plotted on a histogram. Mitochondria in aSyn-expressing axons were more spherical than in wild-type axons, with fewer mitochondria exhibiting a high length:width ratio. (F) Large, swollen mitochondria occupied the spheroids in dystrophic aSyn-expressing axons. Boxed region in F is represented in F2-F3. Red arrowheads point to enlarged mitochondria. [Note that the scale bar in F3 is the same as in B3 and C3 (100 μm).] (G) Mitochondrial transport was evaluated along 50-μm axonal segments every second. Overall mitochondrial transport was significantly reduced in aSyn-expressing axons (WT % motile: 27.4±2.7%; aSyn: 15.05±3.4%; ne20 axons in e10 animals per group, as above; **P =0.0061). (H) A higher percentage of distance traveled by motile mitochondria was in the retrograde direction (WT % retrograde distance: 44.61±5.07%; aSyn: 62.17±6.06%; ne52 mitochondria; *P =0.0300). (I) Motile mitochondria spent less time moving in the anterograde direction (WT: 36.44±4.80%; aSyn: 17.39±4.05%; ne52 mitochondria; **P=0.0063), and a greater percentage of time paused than in wild-type axons (WT: 41.25±4.43%; aSyn: 54.82±4.85%; ne52 mitochondria; *P=0.0478). |