
Fig. S2
- ID
- ZDB-FIG-140612-28
- Publication
- Revenu et al., 2014 - Quantitative cell polarity imaging defines leader-to-follower transitions during collective migration and the key role of microtubule-dependent adherens junction formation
- Other Figures
- All Figure Page
- Back to All Figure Page
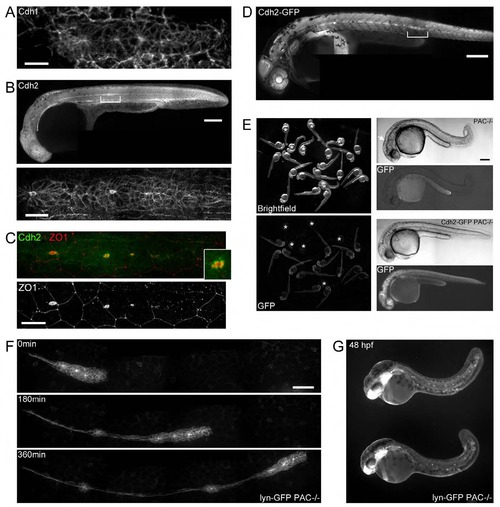
Generation of live adherens junction reporter lines (A) Immunohistochemistry of Cdh1 in the pLLP. (B) Immunohistochemistry of Cdh2 in a 30hpf embryo and in the pLLP (lower panel). (C) Double antibody staining for Cdh2 and ZO1 in the pLLP. The twice-enlarged view of a rosette highlights the broader localisation of Cdh2 around ZO1. (D) Whole embryo overview of the cadherin2:Cadherin2-GFP BAC that recapitulates endogenous Cdh2 expression. Brackets highlight the position of the pLLP. (E) Rescue of the parachute mutant (cdh2tm101b-/-, PAC-/-) by cadherin2:Cadherin2-GFP transgenics. Left panels show a clutch of embryos from an incross of cadherin2:Cadherin2-GFP;cdh2tm101b-/-. Non-transgenic embryos (*) show characteristic mutant phenotype illustrated in the top right panels (curled tail and brain defects, white arrow) whereas transgenic siblings develop normally (bottom right) and survive. Scale bars embryo=200µm, pLLP=20µm. (F) Images from a time-lapse movie of a cldnb:lyn-GFP;cdh2tm101b-/- showing the migration of the pLLP at 30hpf and the formation and deposition of neuromasts in the absence of Cdh2. Scale bar=50µm.(G) 48hpf cldnb:lyn-GFP;cdh2tm101b-/- embryos depicting the posterior lateral line neuromast pattern after the pLLP has reached the tail. |