
Fig. 3
- ID
- ZDB-FIG-140612-26
- Publication
- Revenu et al., 2014 - Quantitative cell polarity imaging defines leader-to-follower transitions during collective migration and the key role of microtubule-dependent adherens junction formation
- Other Figures
- All Figure Page
- Back to All Figure Page
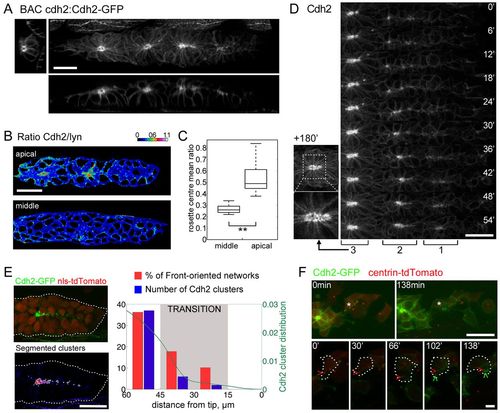
Live imaging of Cdh2 reveals adherens junction assembly during organogenesis. (A) cdh2:Cdh2-GFP BAC recapitulates endogenous Cdh2 expression in the pLLP, showing enriched apical localisation of Cdh2-GFP. The maximal intensity projection of the pLLP is coupled with orthogonal z views. (B) Ratiometric images of cdh2:Cdh2-TagRFP and the membrane marker cldnb:lyn-GFP on confocal z plane show a relative increase of Cdh2 in apical rosette centres (top) that is not seen on middle z planes (bottom). (C) Box plots showing the distribution of the mean ratios in the rosette centre middle z plane and apical z plane (n=13, Wilcoxon paired test, **P<0.01). (D) Concatenated time-lapse images of a Cdh2-GFP pLLP depicting (1) the appearance of apical dots just behind the leading cells and (2) the progressive clustering during rosette formation. The more mature rosette in (3) is shown on the left 3 hours later (top) together with an enlarged view of a single confocal plane (bottom) highlighting the appearance of tiny apical poles. (E) Images of Cdh2-GFP-labelled pLLP before (top) and after (bottom) segmentation of Cdh2-GFP clusters. Histogram (blue) and distribution probability (green) of segmented apical Cdh2-GFP clusters (n=27 pLLP) displayed together with the histogram of the percentage of front-oriented cells (red) in the front part of the pLLP. The transition zone defined in Fig. 2D, where front-oriented cells appear (grey) corresponds to the domain where the first apical clusters are detected. (F) Time-lapse images of Cdh2-GFP, centrin-tdTomato clones of cells in the pLLP. The indicated cell (asterisk) undergoes a transition from rear oriented to front oriented. An enlarged time-lapse view of this cell (bottom, outlined; scale bar: 5 µm) shows the appearance a Cdh2 cluster (green chevron) before the cell shifts. Red chevrons indicate the cell centrosome. Scale bars: 20 µm, unless otherwise stated. |