
Fig. S3
- ID
- ZDB-FIG-140612-29
- Publication
- Revenu et al., 2014 - Quantitative cell polarity imaging defines leader-to-follower transitions during collective migration and the key role of microtubule-dependent adherens junction formation
- Other Figures
- All Figure Page
- Back to All Figure Page
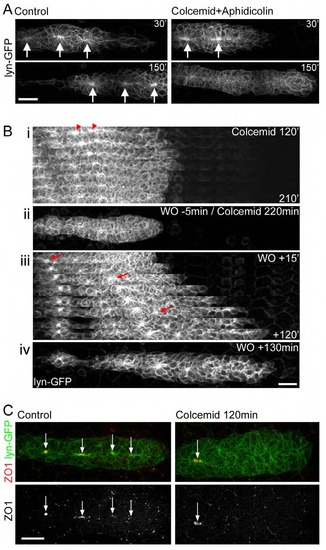
Reversible loss of rosette constrictions upon microtubule depolymerisation (A) Time-lapse images of a control and a pLLP treated with colcemid and aphidicolin, which prevents cell entry into S phase, illustrating rosette disassembly even in absence of mitosis. Arrows indicate rosette constrictions. (B) (i) Concatenated time-lapse images at 15-minute intervals of a cldnb:lyn-GFP pLLP treated with colcemid showing loss of rosettes (red arrowheads). (ii) Image of the same pLLP just before washout and inactivation of the drug (WO). (iii) Concatenated time-lapse images of the pLLP after washout, appearing rosettes are highlighted with red arrows. (iv) Image of the pLLP after washout showing normal tissue organisation. (C) Immunohistochemistry for the tight junction protein ZO1 in a control and a 2 hour-colcemid treated pLLP showing the loss of its apical concentration in a front to back manner after microtubule depolymerisation. Arrows point at apical ZO1 concentrations. Scale bars=20µm. |