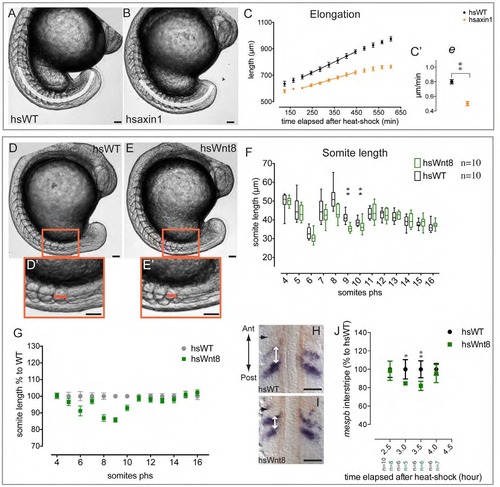
Effect of expression of hsaxin1 on elongation and of hsWnt8 on somite length, related to Figure 1. (A-C′) hsaxin1::YFP heterozygote outcross. (D-J) hsWnt8::GFP heterozygote outcross. (A,B,D,E) Lateral view of representative control (A,D) or transgenic (B,E) embryo when the 9th somite (A,B) or 10th somite (D,E) after the heat-shock is forming. (D′,E′) Close-up of the 3 last formed somites. (C) Mean ± SD of distance between a fixed position in the somites and the posterior tip of the embryo (white line in A,B) over time. (C′) Slope of the linear fit indicated in C. (F) Box plot of somite length (distance between two consecutive notches, orange line in D′,E′) measured from an experiment in which the heat-shock was performed at 6 somites ; n=10 per condition. (G) Normalized mean somite length ± SEM measured from 4 experiments. (H,I) Dorsal view of the anterior PSM of control (H) or transgenic (I) embryos double stained for mespb (blue) and MyoD (red), fixed 3.5 h (~7 somites) after heatshock. (J) Mean ± SD of segment length, the distance between the anterior margins of two mespb stripes measured as indicated with white arrows in H, I, on embryos fixed at successive time points after heat-shock. * p<0.01, ** p<0.001.
|
