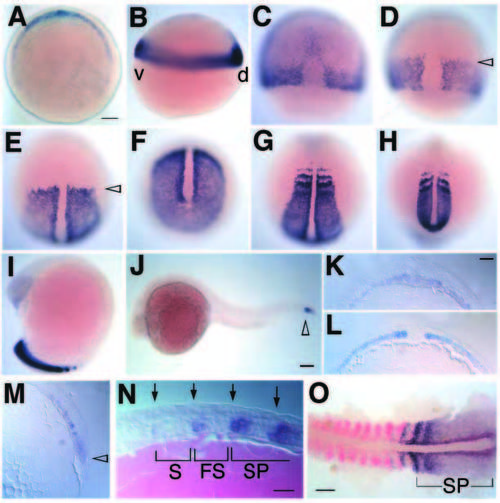
papc expression in wild-type embryos. (A) Animal pole view at 30-40% epiboly stage (5 hours), showing dorsal expression of papc (blue) overlapping with that of goosecoid (which is weakly stained in aquamarine color) at the top of the panel. (B) Lateral view at early gastrula (shield stage, 6 hours); papc is detected in the entire marginal zone. d, dorsal; v, ventral. (C) 60% epiboly stage (7 hours); papc transcripts decrease in the dorsal midline. A weak papc signal is also seen in presumptive head mesendoderm. (D) 70-75% epiboly stage (8 hours); papc expression domain is broader along the animal-vegetal axis (anterior edge indicated by arrowhead); expression in the dorsal midline is undetectable. (E) At the end of gastrulation (bud stage, 10 hours), the anterior and mediolateral borders of papc expression become sharp. The arrowhead marks the anterior border of papc expression. (F) Bud stage, posterior view, the mesoderm ventral to the blastopore is positive for papc RNA. Signals are strongest next to the midline, where the adaxial cell population is located. (G) Dorsal view at 3-somite stage showing papc expression in paraxial mesoderm and anterior segmental bands. (H) Posterior and (I) lateral view at 14-somite stage; papc transcripts are detected in tail presomitic mesoderm. (J) Lateral view of a 24 hour embryo. Expression is detected only in the tip of the tail (arrowhead). (K-N) Sections of embryos hybridized in whole mount. (K) Section through the blastoderm margin at shield stage; expression is restricted to the involuting mesoderm and spans the midline. (L) Transverse section at bud stage (10 hours) showing papc expression in paraxial, but not axial, mesoderm. (M) Parasagittal section of the dorsal side of a late shield-stage embryo. Signal is detected in involuted and involuting hypoblast and the surface epiblast of the blastopore (arrowhead) in the marginal zone. (N) Parasagittal section at the 4-somite stage. The four bands of papc expression are indicated by arrows; weak expression is detectable at the anterior edge of the last formed (S) and forming somite (FS); the two strong bands are located in the segmental plate (SP). Anterior is to the left. (O) Double staining with myoDM (red) and papc (blue) at 8-9 somite stage. Expression of the two genes overlaps in the last formed and the forming somite but not in the segmental plate (SP). Embryo was deyolked manually and flattened. Maternal transcripts were detectable by in situ hybridization at early cleavage stages (data not shown). Bars, 100 mm (A; also applies to B-I); 50 μm (K-M); 25 μm (N); 100 μm (O).
|
