
Fig. 6
- ID
- ZDB-FIG-140114-65
- Publication
- Jayasena et al., 2012 - Rbms3 functions in craniofacial development by posttranscriptionally modulating TGF-β signaling
- Other Figures
- All Figure Page
- Back to All Figure Page
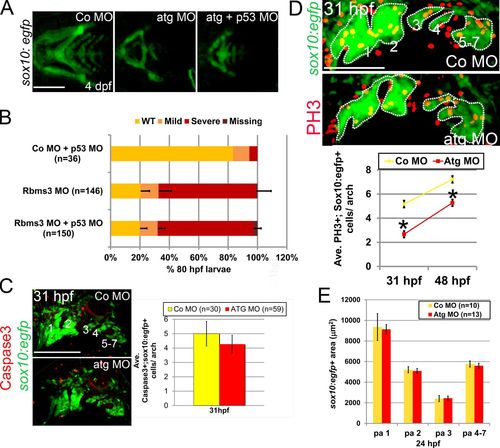
Cell proliferation is defective in rbms3 morphants. (A and B) Co-injection of Atg MO with p53 MO does not rescue the cartilage phenotype. (A) Ventral views of MO-injected fish. (B) Quantitation of the cartilage phenotype: Atg MO coinjected with p53 MO. P > 0.05 (Χ2 test). n = number of larvae pooled from three experiments. Error bars indicate SD. (C) There is no difference in activated Caspase-3 (red) expression in the pharyngeal arches (green; 1–7) in rbms3 morphants. Lateral view of MO-injected sox10:egfp fish at 31 hpf and quantitation of bifluorescent activated Caspase-3+;sox10:egfp+ cells. Error bars indicate SEM. P = 0.5 (Student’s t test). (D) Cell proliferation marker PH3 (red) is reduced in rbms3 morphant pharyngeal arches (green; 1–7). Lateral view of MO-injected sox10:egfp fish at 31 hpf and quantitation of bifluorescent PH3+ and sox10:egfp+ cells in the pharyngeal arches at 31 and 48 hpf. Error bars indicate SEM. *, P < 0.0001 (Student’s t test). (E) Domain of pharyngeal arch (pa) sox10:egfp expression is comparable between MO treatments at 24 hpf. Error bars indicate SD. n = number of fish (B–E). Bars: (A and C) 200 µM; (D) 100 µM. |
| Gene: | |
|---|---|
| Fish: | |
| Knockdown Reagents: | |
| Anatomical Terms: | |
| Stage Range: | Prim-15 to Day 4 |
| Fish: | |
|---|---|
| Knockdown Reagents: | |
| Observed In: | |
| Stage Range: | Prim-15 to Day 4 |