
Fig. 3
- ID
- ZDB-FIG-140114-51
- Publication
- Jayasena et al., 2012 - Rbms3 functions in craniofacial development by posttranscriptionally modulating TGF-β signaling
- Other Figures
- All Figure Page
- Back to All Figure Page
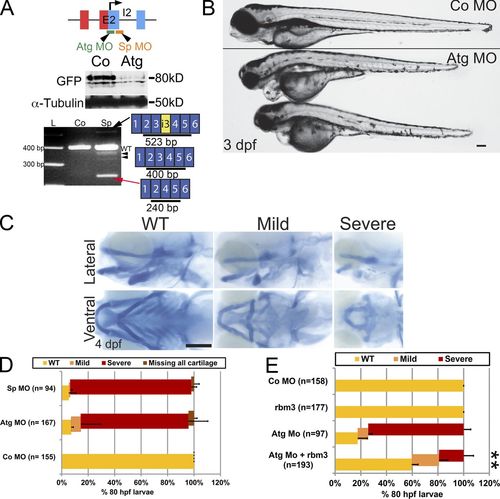
Craniofacial defects in rbms3 morphants. (A) rbms3 MO design (E2, exon 2; I2, intron 2). Atg MO treatment results in knockdown of Citrine-Rbms3 (middle). Sp MO results in skipping of exon 3 (red arrow), and some transcripts maintain a portion of intron 3 (i3, yellow, black arrow), resulting in truncated Rbms3 products. The Sp MO also generates other minor splice variants (black arrowheads). (B) Atg morphants (boxed larvae) show craniofacial defects. (C) Alcian blue cartilage staining in Atg MO–treated fish. Top row, lateral view; bottom row, ventral view. (D) Quantification of cartilage phenotype for Sp and Atg MOs. (E) Full-length rbms3 partially/fully rescues Atg MO severe phenotype (**, P < 0.001, Χ2 test). n = total number of treated fish from 3–4 experiments (D and E). Error bars indicate SD. Bars, 200 µM. |
| Fish: | |
|---|---|
| Knockdown Reagent: | |
| Observed In: | |
| Stage Range: | Protruding-mouth to Day 4 |