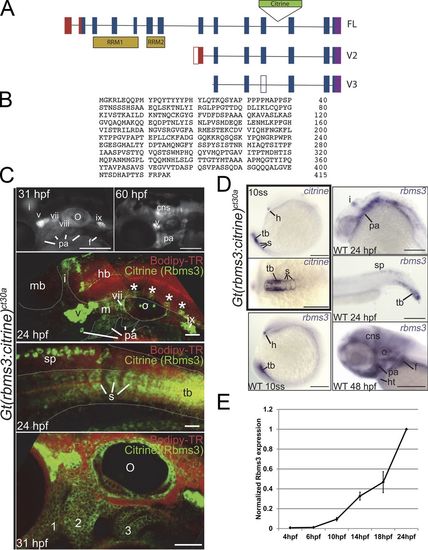
Structure and expression of zebrafish rbms3. (A) Full-length and rbms3 variants v2 and v3 were identified using RACE. (B) Full-length zebrafish Rbms3 is 415 amino acids long. (C and D) Endogenous Rbms3 expression as denoted by Citrine expression in the Gt(rbms3-citrine)ct30a line (C); this closely resembles rbms3 transcript expression in wild-type (WT) zebrafish (D). (C) Citrine fluorescence is detected in craniofacial structures from 24 hpf to 60 hpf. 31 hpf and 60 hpf: live whole-mount images. 24 hpf: confocal z-stacks of the head region (top) and tail region (bottom) in live Gt(rbms3-citrine)ct30a homozygotes stained with the vital dye Bodipy-TR (red). Asterisks indicate Rbms3-expressing neurons. cns, central nervous system; cranial ganglia, v, vii, viii, ix, and x; f, fin bud; hb, hindbrain; i, isthmus; m, mesenchyme; mb, midbrain; o, otic vesicle; pa, pharyngeal arches; s, somites; sp, spinal chord; tb, tail bud mesoderm. 31 hpf: confocal section of head region showing expression in the pharyngeal arches (1–3). (D) Citrine transcript is detected at 10 ss (boxed region in the right panel) in the hatching gland (h), tail bud mesoderm (tb), and somites (s, outlined). Lateral (top) and dorsal (bottom) views shown. (E) QPCR analysis of Rbms3 expression during early embryonic development (n = 3). Error bars indicate SD. Bars: (C, top two fluorescent images; and D) 200 µM; (C, bottom three images) 50 µM.
|
