|
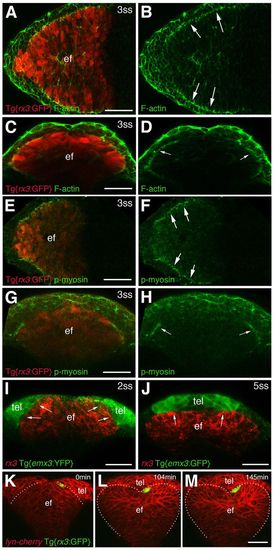
A region of actomyosin activation at the eye field/telencephalic border. (A-H) Whole-mount immunostainings for F-actin and phosphorylated light chain myosin II. Arrows (B,D,F,H) highlight the edge of the eye field. (I,J) Combined in situ hybridisation/immunostaining to detect expression of emx3 (emx3:YFP transgene, green) and rx3 (red). Arrows point at the interface between rx3 and emx3 expression. (K-M) Snapshots taken from supplementary material Movie 1, in which a Tg{rx3:GFP} cell (green) has been transplanted at the edge of the eye field, and its position relative to the boundary then followed over time. The green cell abuts and closely respects the boundary as morphogenesis progresses. The embryo has been counterlabelled with a membrane-tagged form of cherry (Lyn-cherry). All panels show frontal views, except (A,B,E,F) which show dorsal views. ef, eye field; tel, telencephalon. Scale bars: 50 μm.
|