
Fig. 7
- ID
- ZDB-FIG-131218-60
- Publication
- Cavodeassi et al., 2013 - Eph/Ephrin signalling maintains eye field segregation from adjacent neural plate territories during forebrain morphogenesis
- Other Figures
- All Figure Page
- Back to All Figure Page
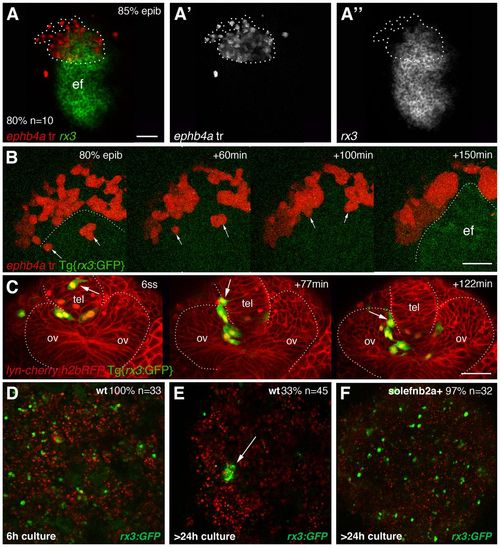
Eye field cells actively segregate from cells in surrounding tissues. (A-A′) Dorsal view of the ANP with anterior to the left, showing a transplant of cells expressing ephb4a (red) straddling the eye/telencephalon domain at 80/90% epiboly. (B) Snapshots of the ANP with anterior to the top taken from supplementary material Movie 2, showing ephb4a+ cells (red, arrows) as they move out from the prospective eye field [labelled by GFP (green) and outlined in the last frame]. (C) Snapshots of the evaginating optic vesicles from a frontal view taken from supplementary material Movie 3, showing an rx3:GFP+ cell mislocated in the telencephalon (arrow) as it relocates into the optic vesicle. The host embryo has been counterlabelled by a membrane-tagged form of cherry (red) and the transplanted cells have their nuclei labelled by H2bRFP (red). (D-F) Confocal images of hanging drop cultures of cells obtained from the dissociation of Tg{rx3:GFP} tailbud stage embryos, cultured for 6 hours (D) or more than 24 hours (E,F). Eye field cells from non-manipulated embryos aggregated in small clusters after long culture times (E, arrow), whereas overexpression of sol-efnb2a results in virtually no embryos forming eye field cell aggregates (F). ef, eye field; ov, optic vesicle. Scale bars: 50 μm. |