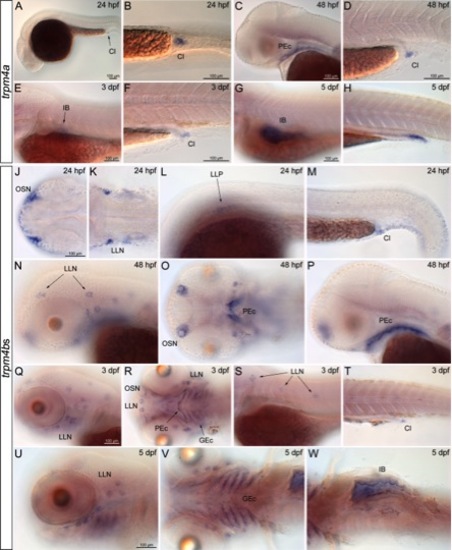
Expression of trpm4 channel genes, trpm4a and trpm4b1, shown in whole-mount during zebrafish development. Expression pattern of both, trpm4b2 and trpm4b3 are identical to trpm4b1. A–K: trpm4a expression. A,B: Lateral (A) and ventral (B) views of embryos 24 hours post fertilization (hpf). C,D: Lateral views of embryos staged 48 hpf. E,F: The 3 days post fertilization (dpf) larvae shown laterally. G,H: Lateral views of larvae staged 5 dpf. J–W: Expression of trpm4bs. J–M: Dorsal (J,K) and lateral (L,M) views of embryos 24 hpf. N–P: Embryos staged 48 hpf shown from the lateral (N,P) and ventral (O) side. Q–T: Lateral (Q,S,T) and ventral (R) views of larvae 3 dpf. U–W: Lateral (U) and ventral (V,W) views of larvae 5 dpf. Zebrafish are orientated with anterior to the left. Scale bars of 100 μm are indicated in the first picture of a series until changed. Cl, cloaca; PEc, pharynx ectoderm; IB, intestinal bulb; OSN, olfactory sensory neurons; LLN, lateral line neuromast; LLP, lateral line primordium; GEc, gill ectoderm.
|
