|
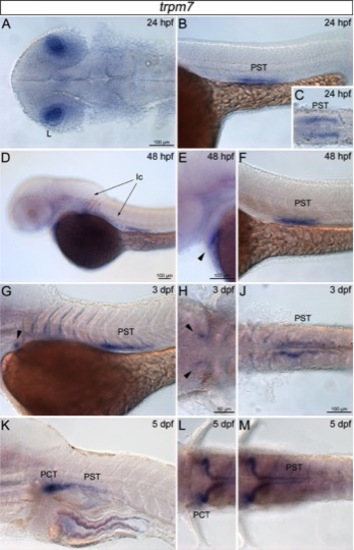
Expression of trpm7 in whole-mount zebrafish during embryonic and larval stages. A–C: Dorsal (A), lateral (B), and ventral (C) views of embryos 24 hours post fertilization (hpf). D–F: Lateral views of embryos staged 48 hpf. G–J: The 3 days post fertilization (dpf) larvae shown from lateral (G) and ventral (H–J) sides, respectively. K–M: Lateral (K) and ventral (L,M) views of larvae staged 5 dpf. Zebrafish are orientated with anterior to the left. Arrowheads in E, G, and H mark expression domains in unspecified anatomical structures. Scale bars of 100 μm are indicated in the first picture of a series until changed, but scale bar in H refers to 50 μm. L, lens; PST, proximal straight tubule; Ic, ionocyte; PCT, proximal convoluted tubule.
|