|
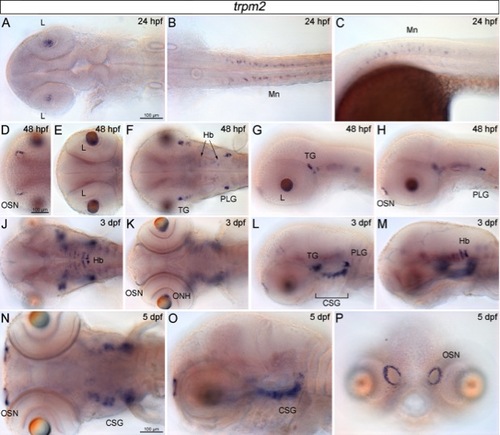
Dynamic expression pattern of trpm2 during zebrafish development, shown in whole-mount views. A–C: Dorsal (A,B) and lateral (C) views of embryos 24 hours post fertilization (hpf). D–H: Ventral (D–F) and lateral (G,H) views of embryos staged 48 hpf. J–M: The 3 days post fertilization (dpf) larvae shown from the dorsal (J), ventral (K), and lateral (L,M) side, respectively. N–P: Ventral (N), lateral (O), and frontal (P) views of larvae staged 5 dpf. Orientation of zebrafish is with anterior to the left in all pictures but P showing a frontal view. Scale bars of 100 μm are indicated in the first picture of a series until changed. L, lens; Mn, motoneurons; OSN, olfactory sensory neurons; TG, trigeminal ganglia; PLG, posterior lateral line ganglia; Hb, hindbrain; ONH, optic nerve head; CSG, cranial sensory ganglia.
|