
Fig. 3
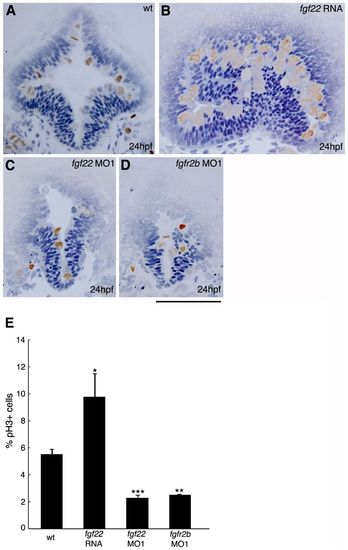
Comparison of cell proliferation in the midbrain of embryos injected with fgf22 RNA, fgf22 MO1, or fgfr2b MO1. (A–D) Wild-type embryos (A) and embryos injected with fgf22 RNA (B), fgf22 MO1 (C), or fgfr2b MO1 (D) were stained using an anti-pH3 antibody. Panels show representative transverse sections of the midbrain at 24 hpf. Scale bar: 100μm. (E) The percentage of proliferating cells labelled with anti-pH3 antibody in the midbrain of wild-type embryos and embryos injected with fgf22 RNA, fgf22 MO1, or fgfr2b MO1. Results are the mean ± S.D. for three independent sections from three embryos. The statistical significance of differences in mean values was assessed with the Student′s t-test. Asterisks indicate statistical significance compared with the wild type (*P<0.05; **P<0.01; ***P<0.001). |
| Fish: | |
|---|---|
| Knockdown Reagents: | |
| Observed In: | |
| Stage: | Prim-5 |