
Fig. 1
- ID
- ZDB-FIG-130815-1
- Publication
- Choudhuri et al., 2013 - Translation initiation factor eIF3h targets specific transcripts to polysomes during embryogenesis
- Other Figures
- All Figure Page
- Back to All Figure Page
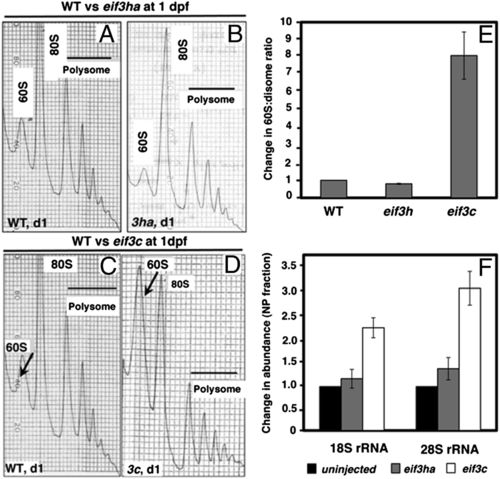
Comparison of the polysome profiles obtained from cell-free extracts of eif3ha or eif3c morphant embryos with the corresponding WT embryos. (A-D) Representative profiles derived from cell-free extracts of WT or morphant embryos, as indicated. The arrows in C and D indicate changes in the amounts of 60S subunits observed in the stage-matched WT and eif3c morphants at 1 dpf. (E) Quantitation showing the change of the 60S:disome ratios for individual eif3 morphants with respect to the corresponding WT embryos. (F) qPCR data measuring the relative abundance of 18S rRNA and 28S rRNA, as surrogate measures for the changes in abundance of 40S and 60S subunits, respectively. |
| Fish: | |
|---|---|
| Knockdown Reagent: | |
| Observed In: | |
| Stage: | Prim-5 |