
Fig. 5
- ID
- ZDB-FIG-130802-48
- Publication
- Aoki et al., 2013 - Imaging of Neural Ensemble for the Retrieval of a Learned Behavioral Program
- Other Figures
- All Figure Page
- Back to All Figure Page
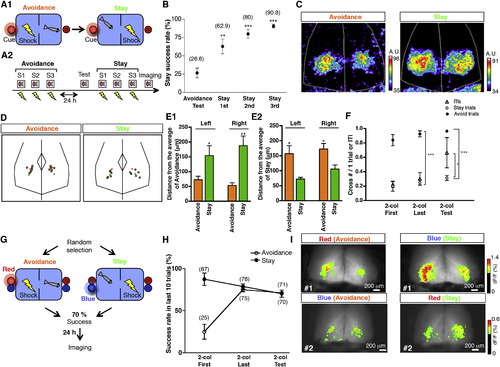
Zebrafish Learn and Encode the Behavioral Rule Change (A1) In the original active avoidance paradigm (avoidance task), fish had to swim into the other compartment to avoid the punishment upon the cue presentation. After a change in the learning contingency (stay task), fish had to stay in the same compartment with the cue turned on to avoid the punishment. (A2) Experimental schedule. On the first day, fish were trained for the avoidance task. Then, at 24 hr after the last training, fish were first tested for their retrieval of the avoidance behavior trained in the avoidance task, rested for 20 min, and then trained for the stay task. Imaging was performed 30 min after the last stay training. (B) The percentage of successful trials for stay training out of the total trial numbers was plotted as stay success rate (percentage). Dots and bars represent the mean ± SEM, respectively. Stay success rate increased as stay training sessions were repeated and reached over 80% after three sessions. The stay success rate averages were as follows: avoidance test = 26.6%, stay first session = 62.9%, stay second session = 80%, stay third session = 90.8%. n = 6. Statistical analysis was performed by repeated-measures one-way ANOVA and Bonferroni’s multiple comparison test. Avoidance test versus stay 1st, **p < 0.01; avoidance test versus stay 2nd, ***p < 0.001; avoidance test versus stay 3rd, ***p < 0.001. Stay 1st: stay task first session, stay 2nd: stay task second session, stay 3rd: stay task third session. (C) Representative individual activity maps for the avoidance and stay task memory retrieval. The activity pattern for stay is broader than for avoidance. (D) Distribution of the activity centers of individuals trained in the schedule as in (A2). Orange circles indicate activity centers for the avoidance task (n = 7) and green circles indicate activity centers for the stay task (n = 6). The orange and green crosses indicate the average points for the avoidance and stay activity centers, respectively. (E1 and E2) Avoidance task clusters of activity centers calculated from individuals trained in the schedule as in (A2) are significantly shifted from stay task clusters. Columns and bars represent the mean ± SEM, respectively. Avoidance task, n = 7; stay task, n = 6. (E1) Distances from the average point of the activity centers for the avoidance task to each activity center for the avoidance task and stay task were calculated for each hemisphere. *p < 0.05 and **p < 0.01, unpaired t test. (E2) Distances from the average point of activity centers for the stay task to each activity center for avoidance task and stay task were calculated for each hemisphere. *p < 0.05, unpaired t test. (F) Number of crossing the hurdle during two-color conditioning and test was plotted (cross-number/1 trial or ITI). Dots and bars represent the mean ± SEM, respectively. n = 8. *p < 0.05, ***p < 0.001, two-way ANOVA, Bonferroni’s post test. 2-col first, two-color conditioning first training session; 2-col last, two-color conditioning last training session; 2-col Test, two-color conditioning test session. The open triangle indicates cross-numbers during ITIs, the open circle indicates cross-numbers during stay task trials, and the filled circle indicates cross-numbers during avoidance task trials. (G) In two-color conditioning paradigm, the main program randomly selects one of the two tasks, avoidance and stay tasks. When the success rate becomes above 70% for both tasks, the training was stopped. Twenty-four hours after the last training, the calcium imaging was performed. Either of red LED-avoidance task/blue LED-stay task contingency or blue LED-avoidance task/red LED-stay task contingency was adopted. The same contingency was applied to one fish throughout the training period. (H) The percentage of successful trials for each task in last ten trials. Open circle indicates the percentage of avoidance and the black filled circle indicates the percentage of stay. Circles and bars represent the mean ± SEM, respectively. The success rate averages were avoidance first training = 25%, stay first training = 87.3%, avoidance last training = 75%, stay last training = 78.7%, avoidance test = 71.1%, and stay test = 70.2%. n = 8. (I) The representative activity pattern for each contingency. Fish 1 was trained with red LED-avoidance task/blue LED-stay task contingency. Fish 2 was trained with blue LED-avoidance task/red LED-stay task contingency. Scale bars indicate 200 μm. See also Figure S5 and Movie S6. |