
Fig. 3
- ID
- ZDB-FIG-130802-46
- Publication
- Aoki et al., 2013 - Imaging of Neural Ensemble for the Retrieval of a Learned Behavioral Program
- Other Figures
- All Figure Page
- Back to All Figure Page
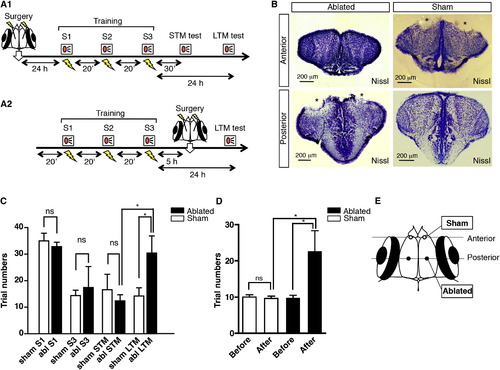
Lesion of Activated Areas Impairs Retrieval of the Long-Term Stored Avoidance Behavior (A1) Experimental schedule for the ablation before training. On the first day, fish underwent the surgery and were kept overnight for the recovery. On the second day, fish were trained in active avoidance learning as described. The short-term memory (STM) was tested 30 min after the last training session and the long-term memory (LTM) was tested 24 hr after the last training. S1, session 1; S2, session 2; S3, session 3. (A2) Experimental schedule for the ablation after training. Fish were first trained in active avoidance learning as described. Surgery was then conducted at 5 hr after the last training, and a retention test was performed 24 hr after the last training. (B) Representative examples of the activated area-ablated and sham-operated individuals. Section level is indicated in (E). Anterior (sham-operation-level) and posterior (the activity spot-level) sections with Nissl staining are shown in coronal view. Stars indicate the ablated sites. (C) The ablation before training does not affect the acquisition of the learning and STM but does affect the LTM. Columns and bars represent the mean ± SEM, respectively. Sham, n = 5; abl, n = 5. The average trial numbers required to achieve the learning criterion were 35 and 32.8 for sham S1 and abl S1, 14.4 and 17.4 for sham S3 and abl S3, 16.6 and 12.4 for sham STM and abl STM, and 14.2 and 30.4 for sham LTM and abl LTM. Sham S1 versus abl S1, p = 0.2642, unpaired t test. Sham S3 versus abl S3, p = 0.3659, unpaired t test. Sham STM versus abl STM, p = 0.2604, unpaired t test, sham LTM versus abl LTM, *p < 0.05, unpaired t test. abl STM versus abl LTM, *p < 0.05, sham STM versus sham LTM, p = 0.3641, unpaired t test. abl, ablated. (D) The effect of ablation at 24 hr after training on the retrieval of the avoidance behavior. Columns and bars represent the mean ± SEM, respectively. Sham, n = 8; abl, n = 14. The average trial numbers required to achieve the learning criterion were 10 and 9.6 before and after the sham procedure, respectively, and 9.6 and 23.6 before and after ablation, respectively. Sham before versus sham after, p = 0.35, paired t test. Ablated before versus ablated after, *p < 0.05, paired t test. Sham after versus ablated after, *p < 0.05, unpaired t test. (E) Schematic map for the ablation sites. Black circles indicate activity spot ablation sites. White circles indicate sham-operated ablation sites. For calculation of the site, see Experimental Procedures.See also Figure S3. |