
Fig. 2
- ID
- ZDB-FIG-130802-45
- Publication
- Aoki et al., 2013 - Imaging of Neural Ensemble for the Retrieval of a Learned Behavioral Program
- Other Figures
- All Figure Page
- Back to All Figure Page
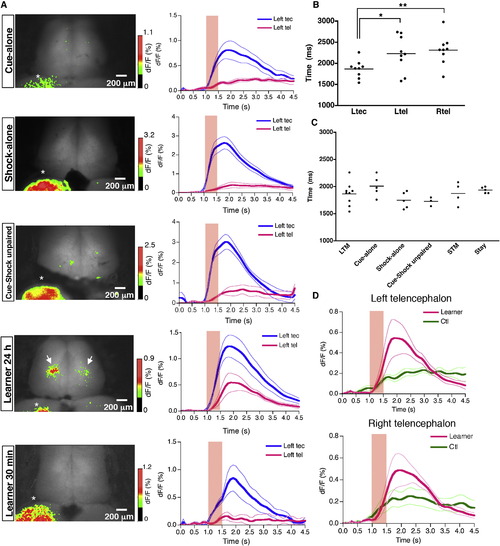
Calcium Signals Encoding Memory Retrieval in Zebrafish Telencephalon (A) Left: example of individual activity pattern for each experimental group. The image was taken at 1 s after the cue presentation. Star indicates the activity in the optic tectum. Arrows indicate the activity spots in the telencephalon specific to the learner fish 24 hr after the training. Right: averaged temporal sequence of fluorescence change of each experimental group in the left optic tectum (blue line, Left tec) and the left telencephalon (pink line, Left tel). The mean ± SEM is plotted. The cue presentation period was indicated with a red shadowed box. Cue-alone, n = 6; shock-alone, n = 4; cue-shock unpaired, n = 5, learner 24 hr, n=7; learner 30 min, n=4. (B) Comparison of the average of the peak time for left tectum (Ltec), left telencephalon (Ltel), and right telencephalon (Rtel) in the learner group. The peak times in the left (2,228 ± 401 ms) and right (2,313 ± 328 ms) telencephalon are significantly later than that in the left tectum (1,864 ± 197 ms). *p < 0.05, **p < 0.01, unpaired t test. There was no significant difference between the peak times in the left and right telencephalon. p = 0.6516, unpaired t test. (C) Comparison of the average of the peak time for left tectum in all experimental conditions including stay task (see Figure 5). LTM, learner imaged 24 hr after the last training; STM, learner imaged 30 min after the last training. LTM (1,864 ± 197 ms) versus cue-alone (2,008 ± 170 ms), p = 0.2308, unpaired t test. LTM versus shock-alone (1,748 ± 135 ms), p = 0.2993, unpaired t test. LTM versus cue-shock unpaired (1,726 ± 65 ms), p = 0.3052, unpaired t test. LTM versus STM (1,875 ± 179 ms), p = 0.9346, unpaired t test. LTM versus stay (1,936 ± 49 ms), p = 0.3604, unpaired t test. (D) Comparison of the averaged temporal sequence of fluorescence change of the telencephalon between the cue-alone group (green line) and the learner group (pink line). The mean ± SEM is plotted. The cue presentation period is indicated with a red shadowed box. See also Movies S3, S4, and S5 and Figure S2. |