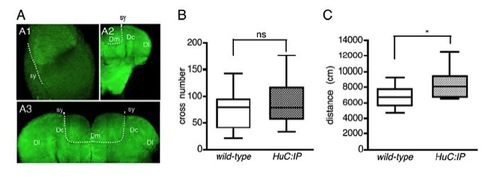
(A) Expression of inverse pericam (IP) in the telencephalon of adult HuC:IP transgenic fish.
(A1) Dorsal view of the right hemisphere. The midline to the left and anterior to the top. Dotted line indicates the position of the sulcus ypsilonformis (sy). The region lateral to sy is brighter than the medial part. The anterior half region is also brighter than the posterior half region.
(A2) Coronal view of the right hemisphere. The midline to the left and dorsal to the top. Arrowhead indicates sy. Dotted line indicates the border of the medial zone of the dorsal telencephalon (Dm). The intensity of IP expression in the region medial to the sy corresponding to Dm is less bright than the other parts that encompass the central and lateral zones of the dorsal telencephalon (Dc and Dl).
(A3) Magnified image of (A2). Arrowheads indicate sy. Dotted line indicates the border of Dm. The IP expression was lower in Dm (arrows) than other regions of the dorsal telencephalon.
(B, C) Swimming behavior of HuC:IP transgenic fish. (B) The number of crossing the hurdle during the adaptation period in the first training session was not significantly different between wild-type and HuC:IP transgenic groups. P=0.2046, unpaired t-test, N=26. ns, not significant.
(C) HuC:IP fish showed a slight increase in swimming distance during the adaptation period in the first training session compared to wild types. *P<0.05, unpaired t-test, N=13.
|
