
Fig. 7
- ID
- ZDB-FIG-130726-33
- Publication
- Head et al., 2013 - Activation of canonical Wnt/beta-catenin signaling stimulates proliferation in neuromasts in the zebrafish posterior lateral line
- Other Figures
- All Figure Page
- Back to All Figure Page
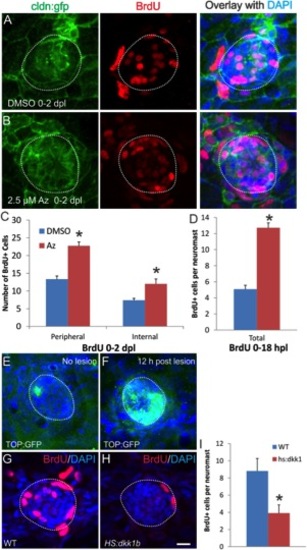
Wnt signaling controls regenerative proliferation in the lateral line neuromasts following hair cell lesion. A–D: Az stimulates an increase in the number of proliferative supporting cells following aminoglycoside lesioning of hair cells. Five-day-old fish were treated with 500 μM neomycin for 1 hr to kill the hair cells, then incubated in DMSO as a control (A) or 2.5 μM Az to stimulate Wnt signaling (B) with BrdU present continuously for 2 days post-lesion. C: Quantification of the number of BrdU-positive cells at 2 days post-lesion shows that Az led to a doubling in the number of dividing internal supporting cells and peripheral supporting cells (P < 0.001 for each; t-test). D: Quantification of BrdU-positive cells from DMSO-treated or Az-treated fish 18 hr after neomycin-induced lesion of the hair cells. Az again stimulated more than twice the number of BrdU+ cells compared to controls within 18 hr of the lesion. E,F: TOP:gfp expression shows upregulation of canonical Wnt cascade following neomycin-induced hair cell lesion. E: Six-dpf zebrafish not subject to neomycin shows little expression of the TOP:gfp transgene in neuromasts. F: Six-dpf zebrafish 12 hr after treatment with 500 μM neomycin shows upregulation of the TOP:gfp transgene, suggesting activation of the canonical Wnt pathway. G–I: Induction of the Wnt-inhibitory dkk1b in Tg(hsp70:dkk1b) zebrafish suppresses proliferation following neomycin-induced hair cell damage, with heat shock prior to the neomycin lesion and BrdU present from 0–18 hr following the lesion. G: Wildtype siblings show normal regenerative response 18 hr after lesion. H: In contrast, transgenic fish expressing dkk1b show few regenerating cells. I: The number of proliferating cells 18 hr after neomycin lesion is significantly lower in dkk1b-expressing fish than in wildtype controls (*P < 0.05; t-test). In all images, the dashed line shows the extent of the neuromast. Scale bar = 10 μm. |